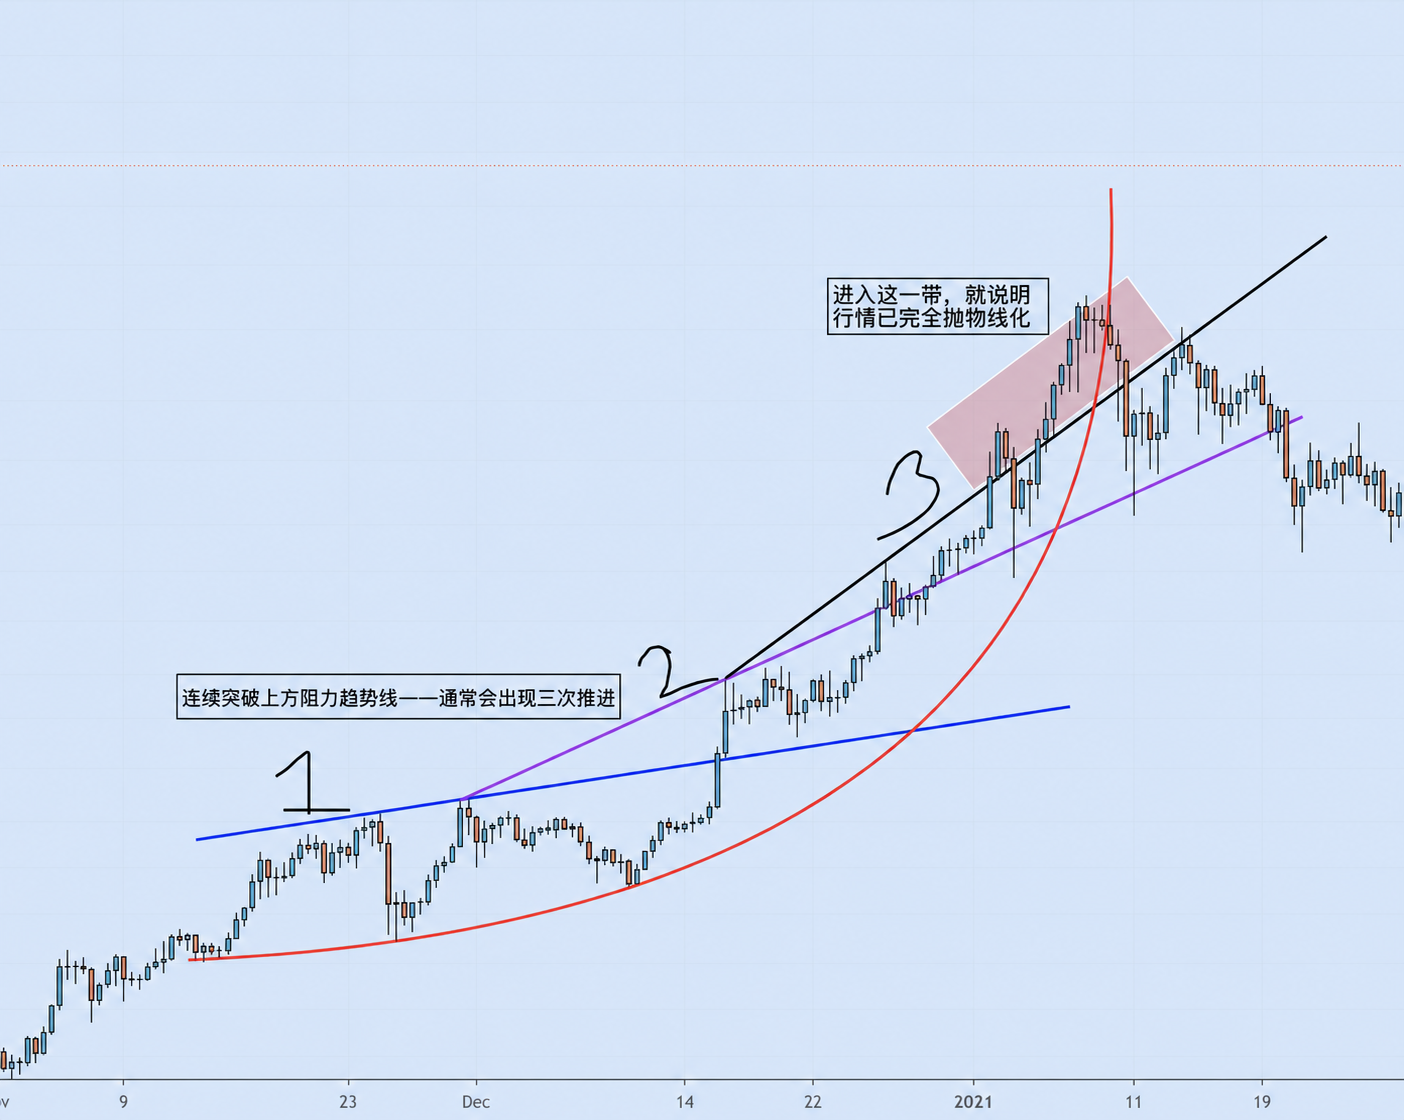
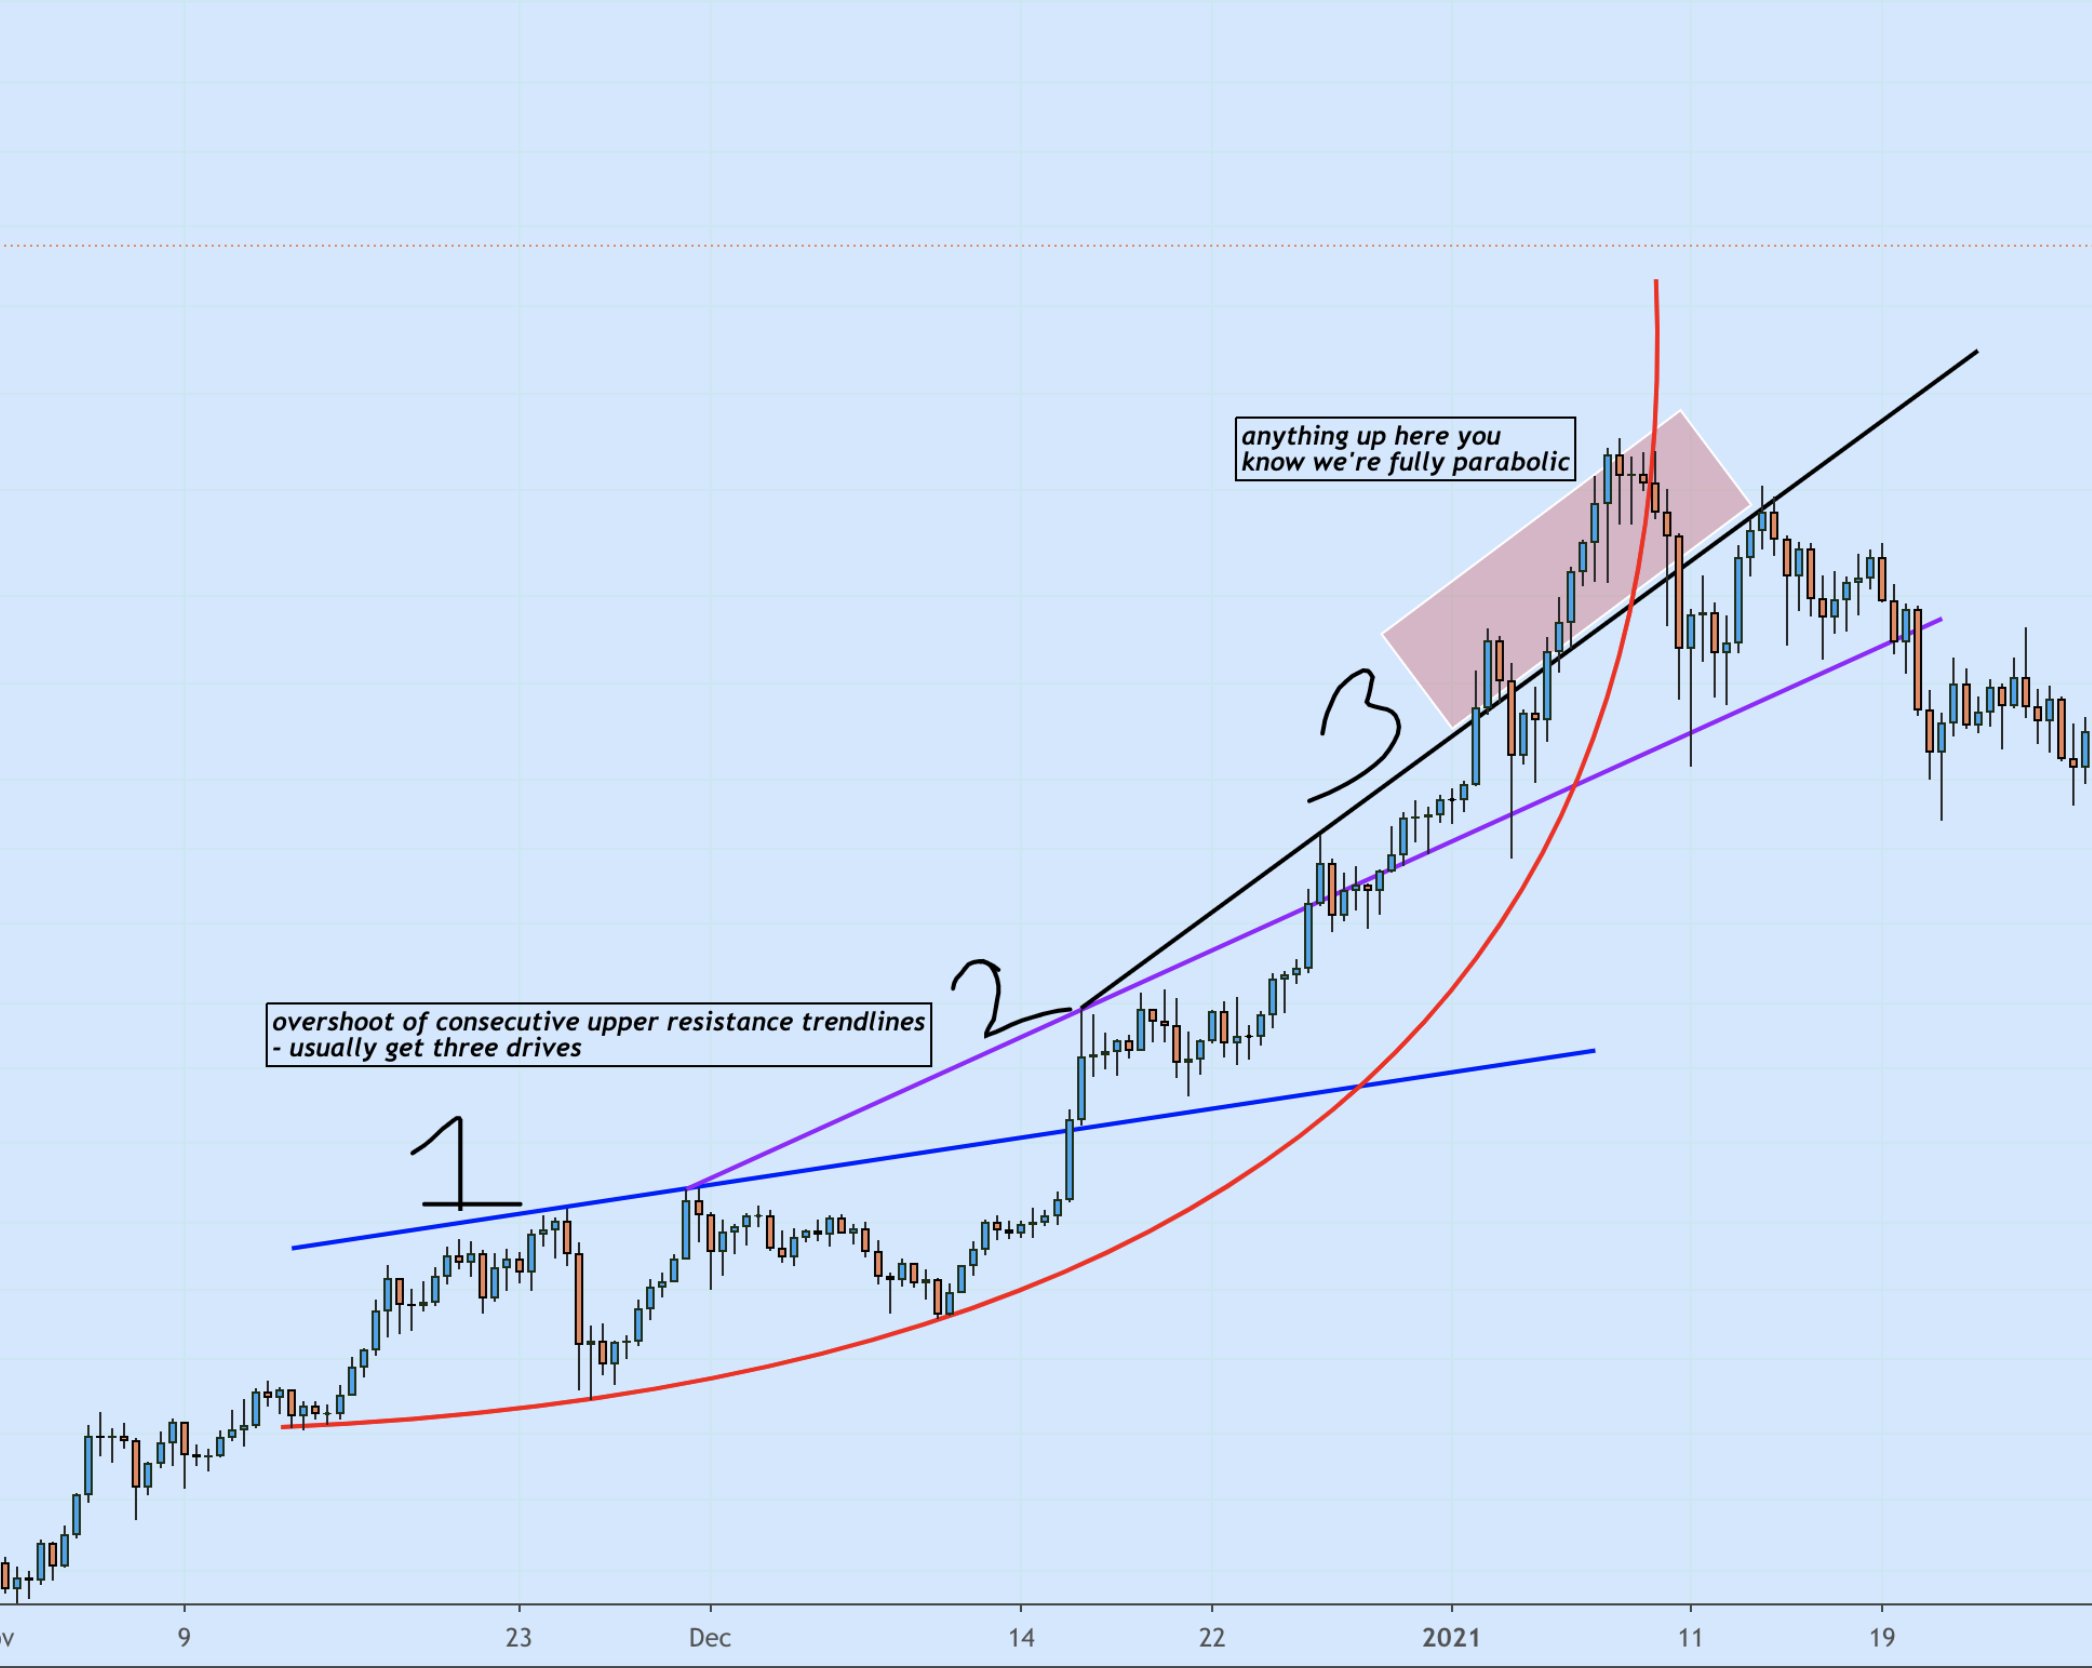
first you need to identify whether the asset is parabolic or not, best way to do this for me is to use trendlines. if you get three drives breaking upper resistance trendlines you’re usually nearing the end of a parabola
Figure 1: Three consecutive upper-resistance trendline breaks forming the classical “three drives” parabolic top. Red curve = the parabolic price move itself; blue / purple / black hand-drawn trendlines = the three resistance levels being overtaken in order.
when we’re up in this area is where you should be cautious, either start using trailing stops or start preparing a plan for what you’ll do if we do get a deeper selloff. It’s really easy to sell too early here and watch price keep going up because it can stay parabolic for awhile
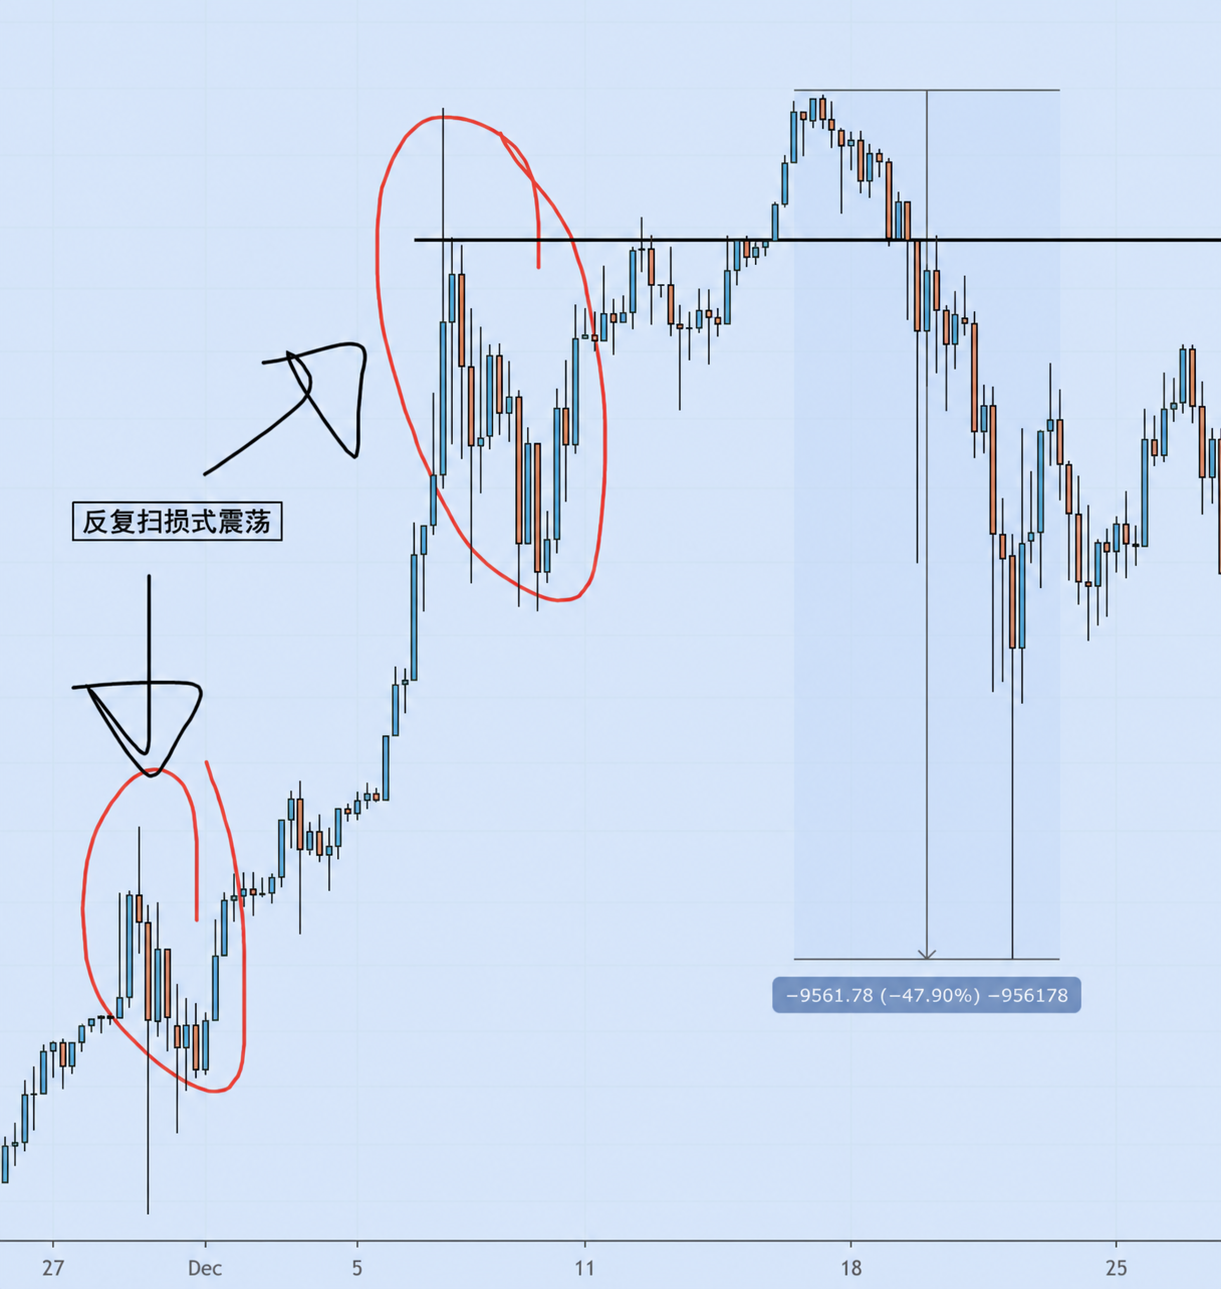
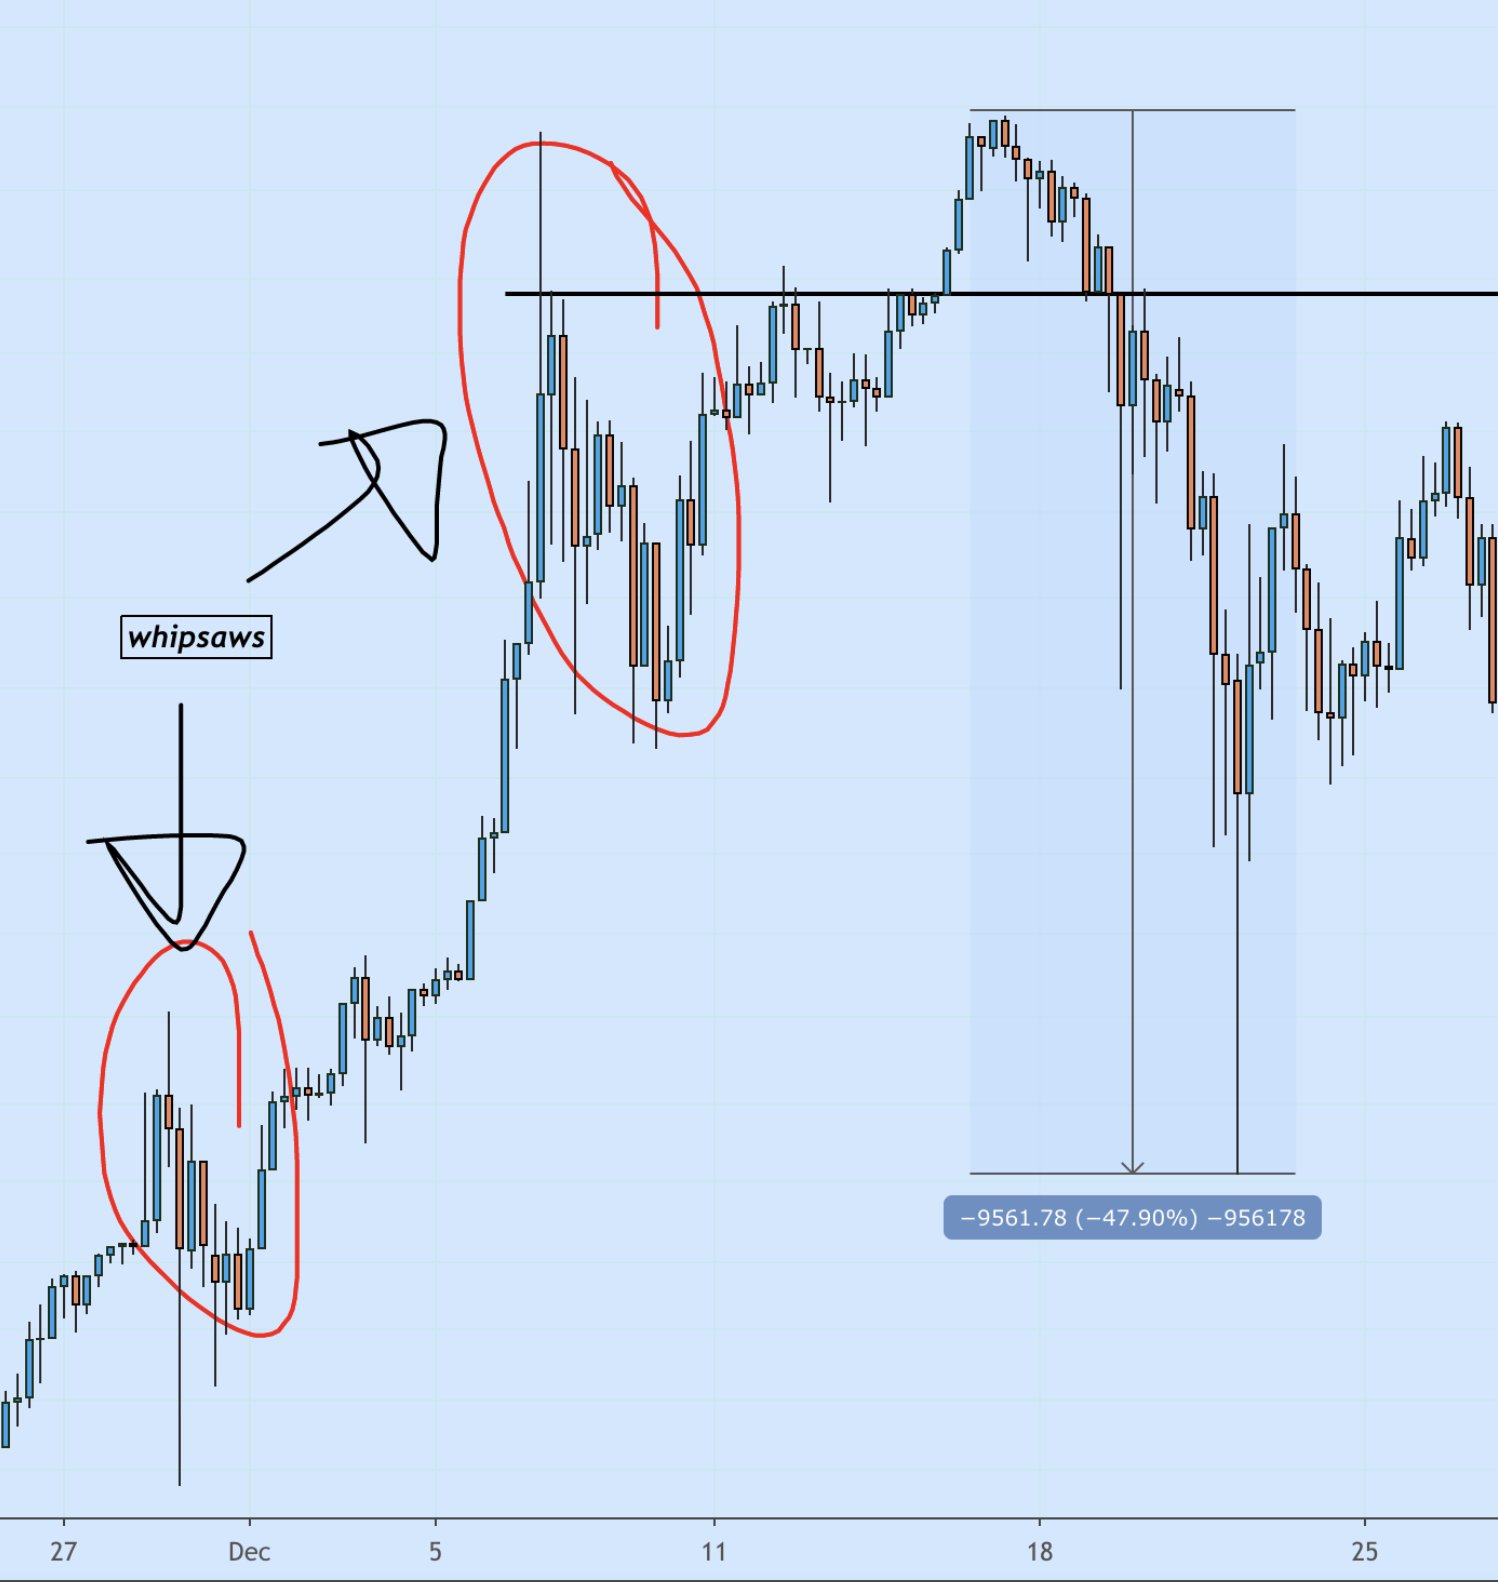
another sign is when you see volatility increase & you get to look for these whipsaw like moves, another sign that a deeper pullback is coming soon
Figure 2: Whipsaw-style false breakouts / breakdowns at resistance, the late-stage signature of a parabolic run. Right-side blue tag “−9561.78 (−47.90%)” records the subsequent real pullback.
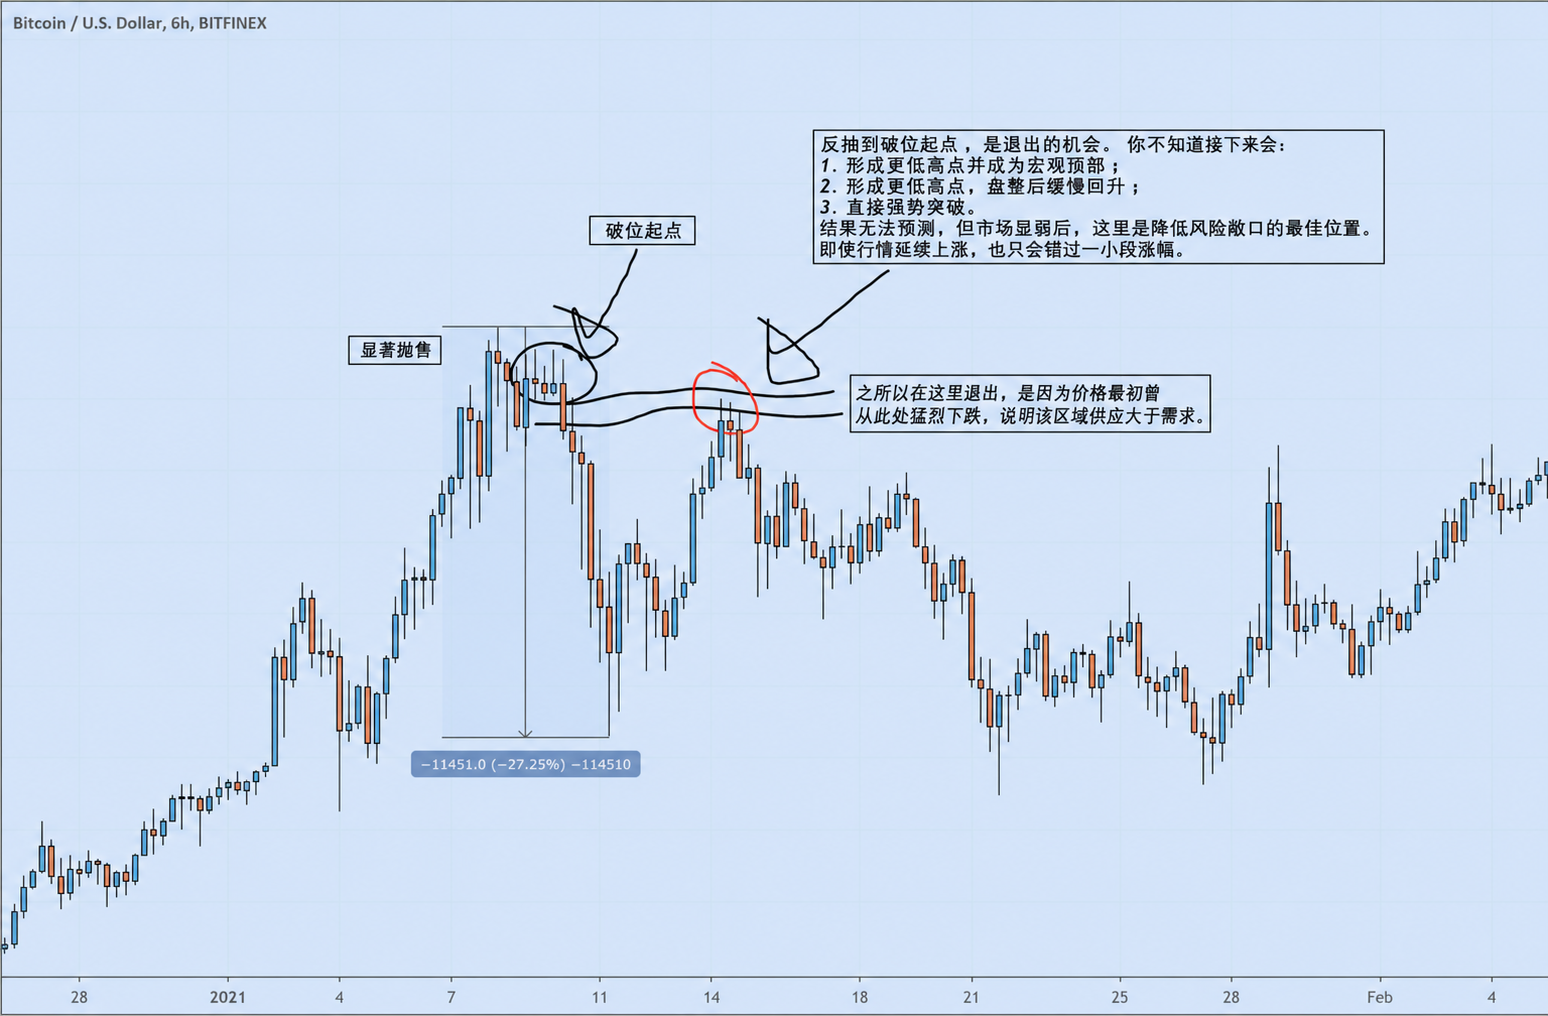
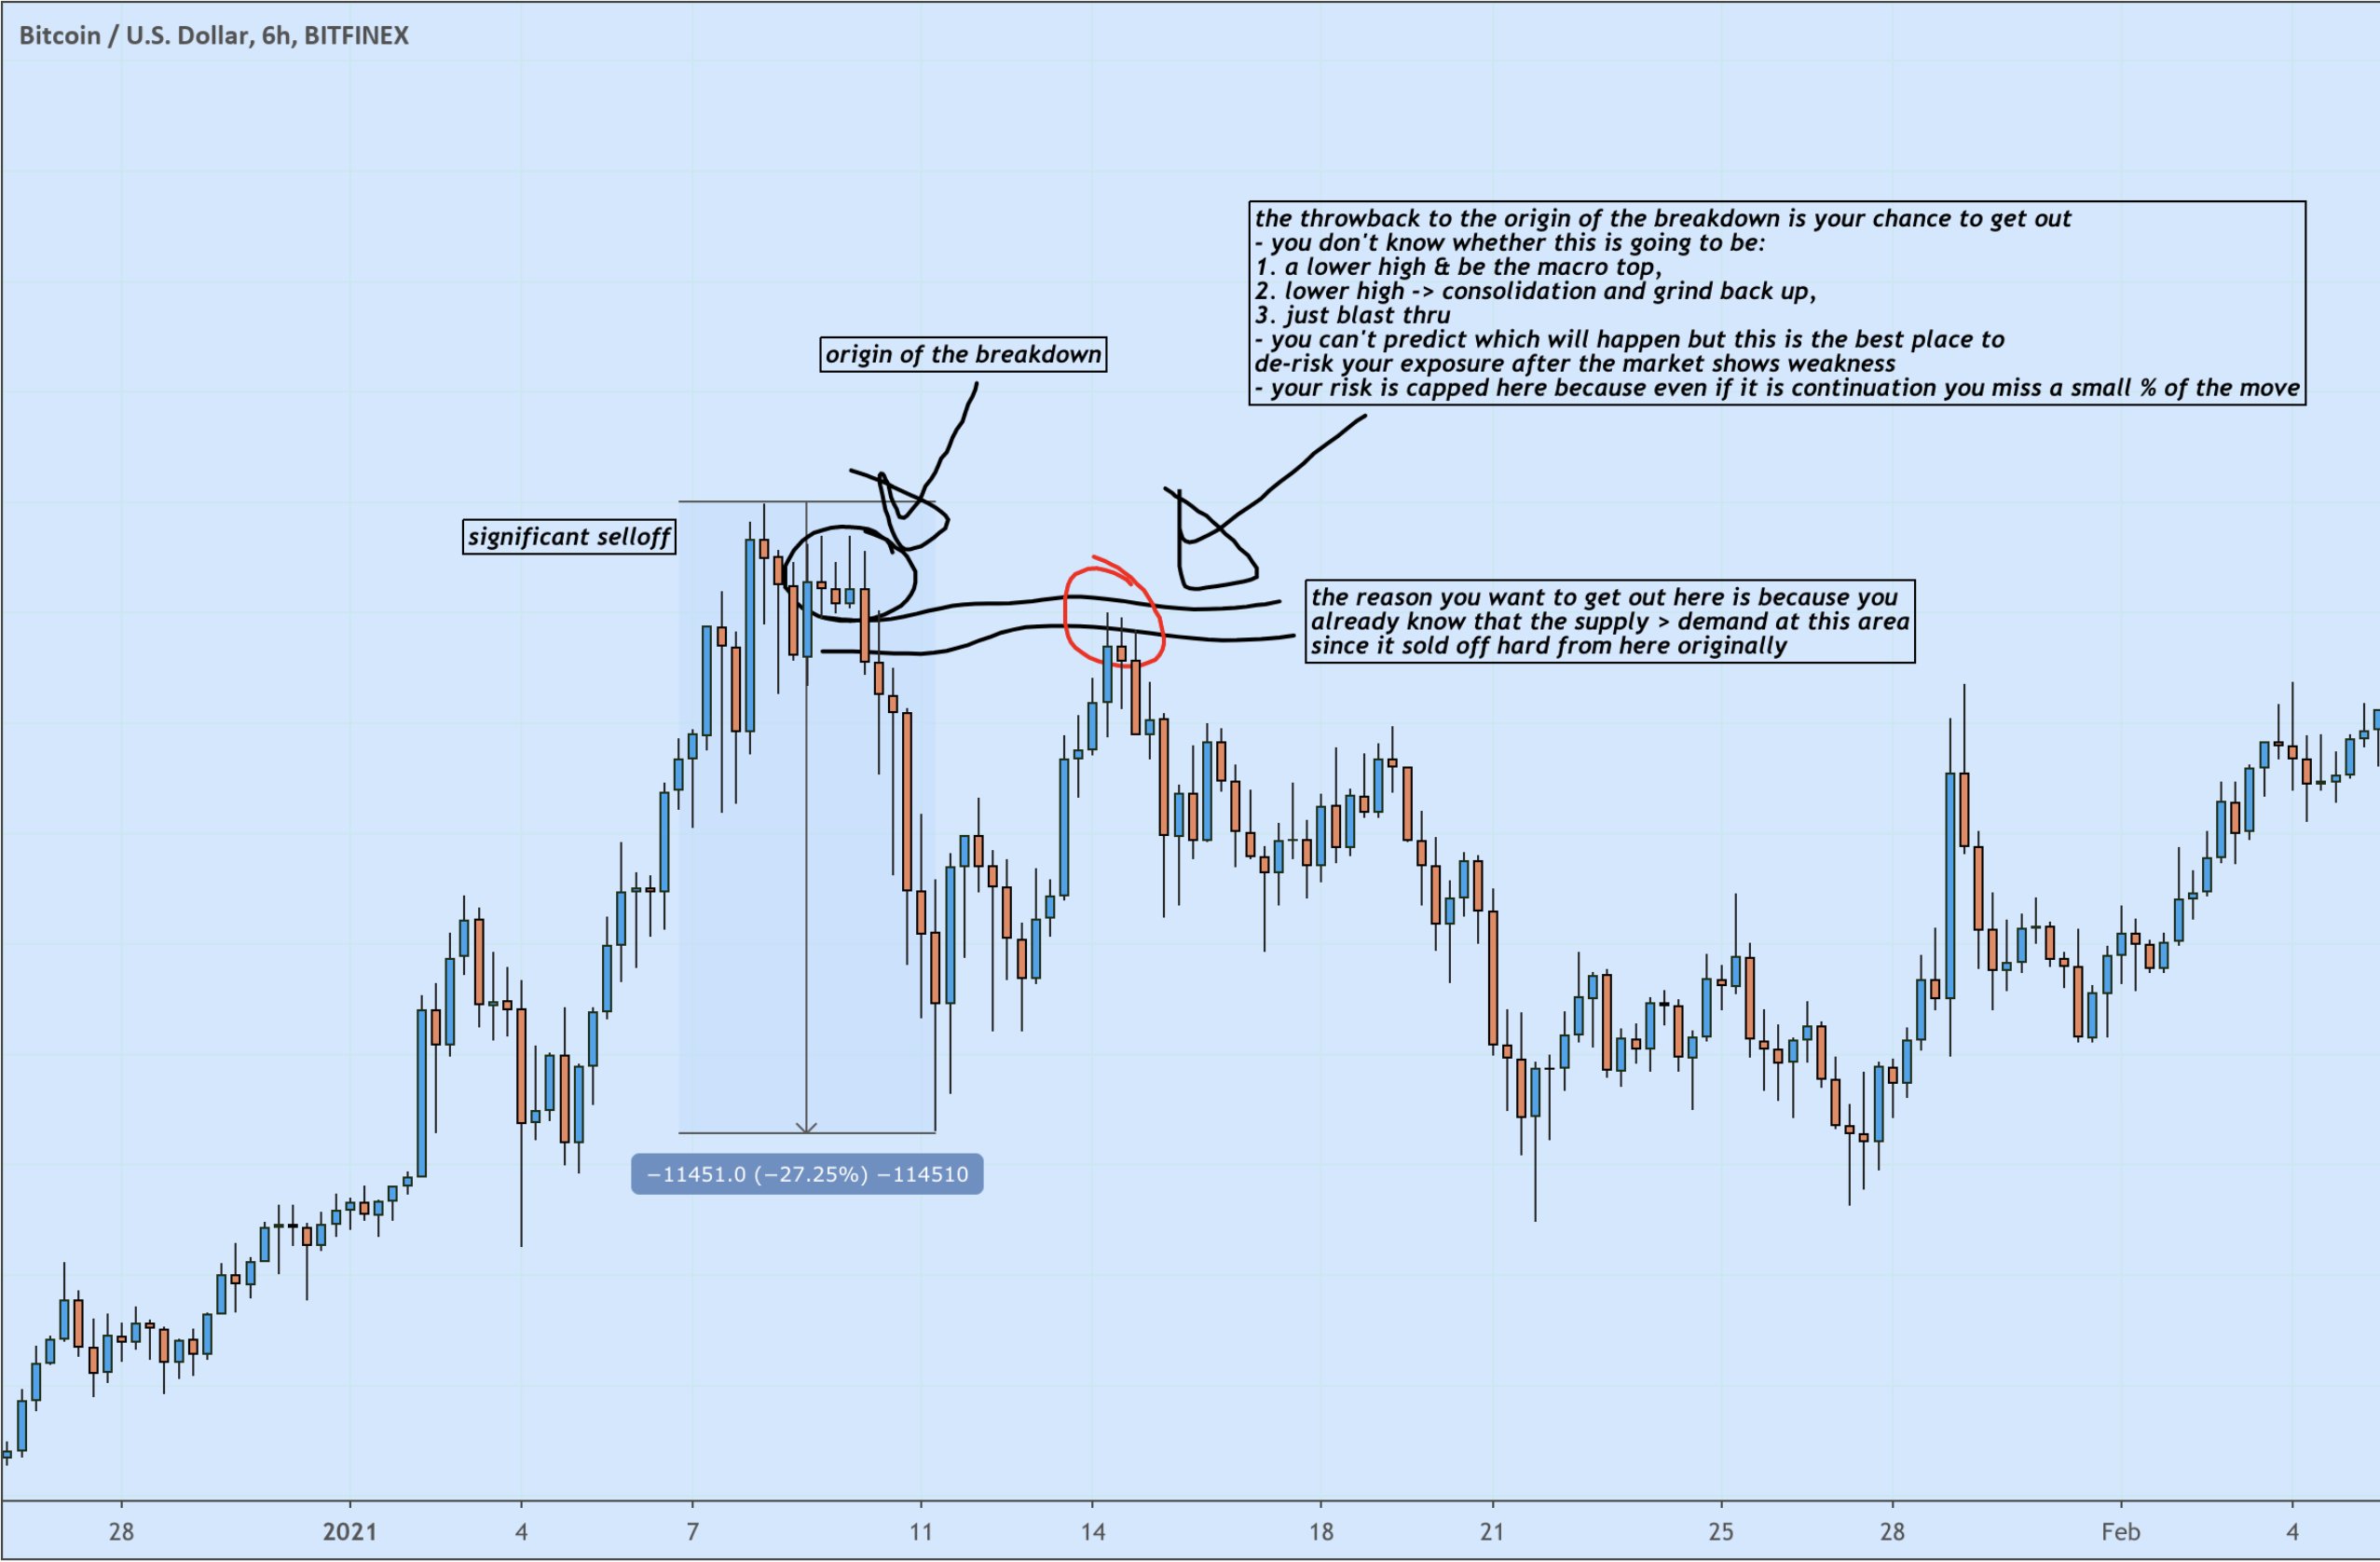
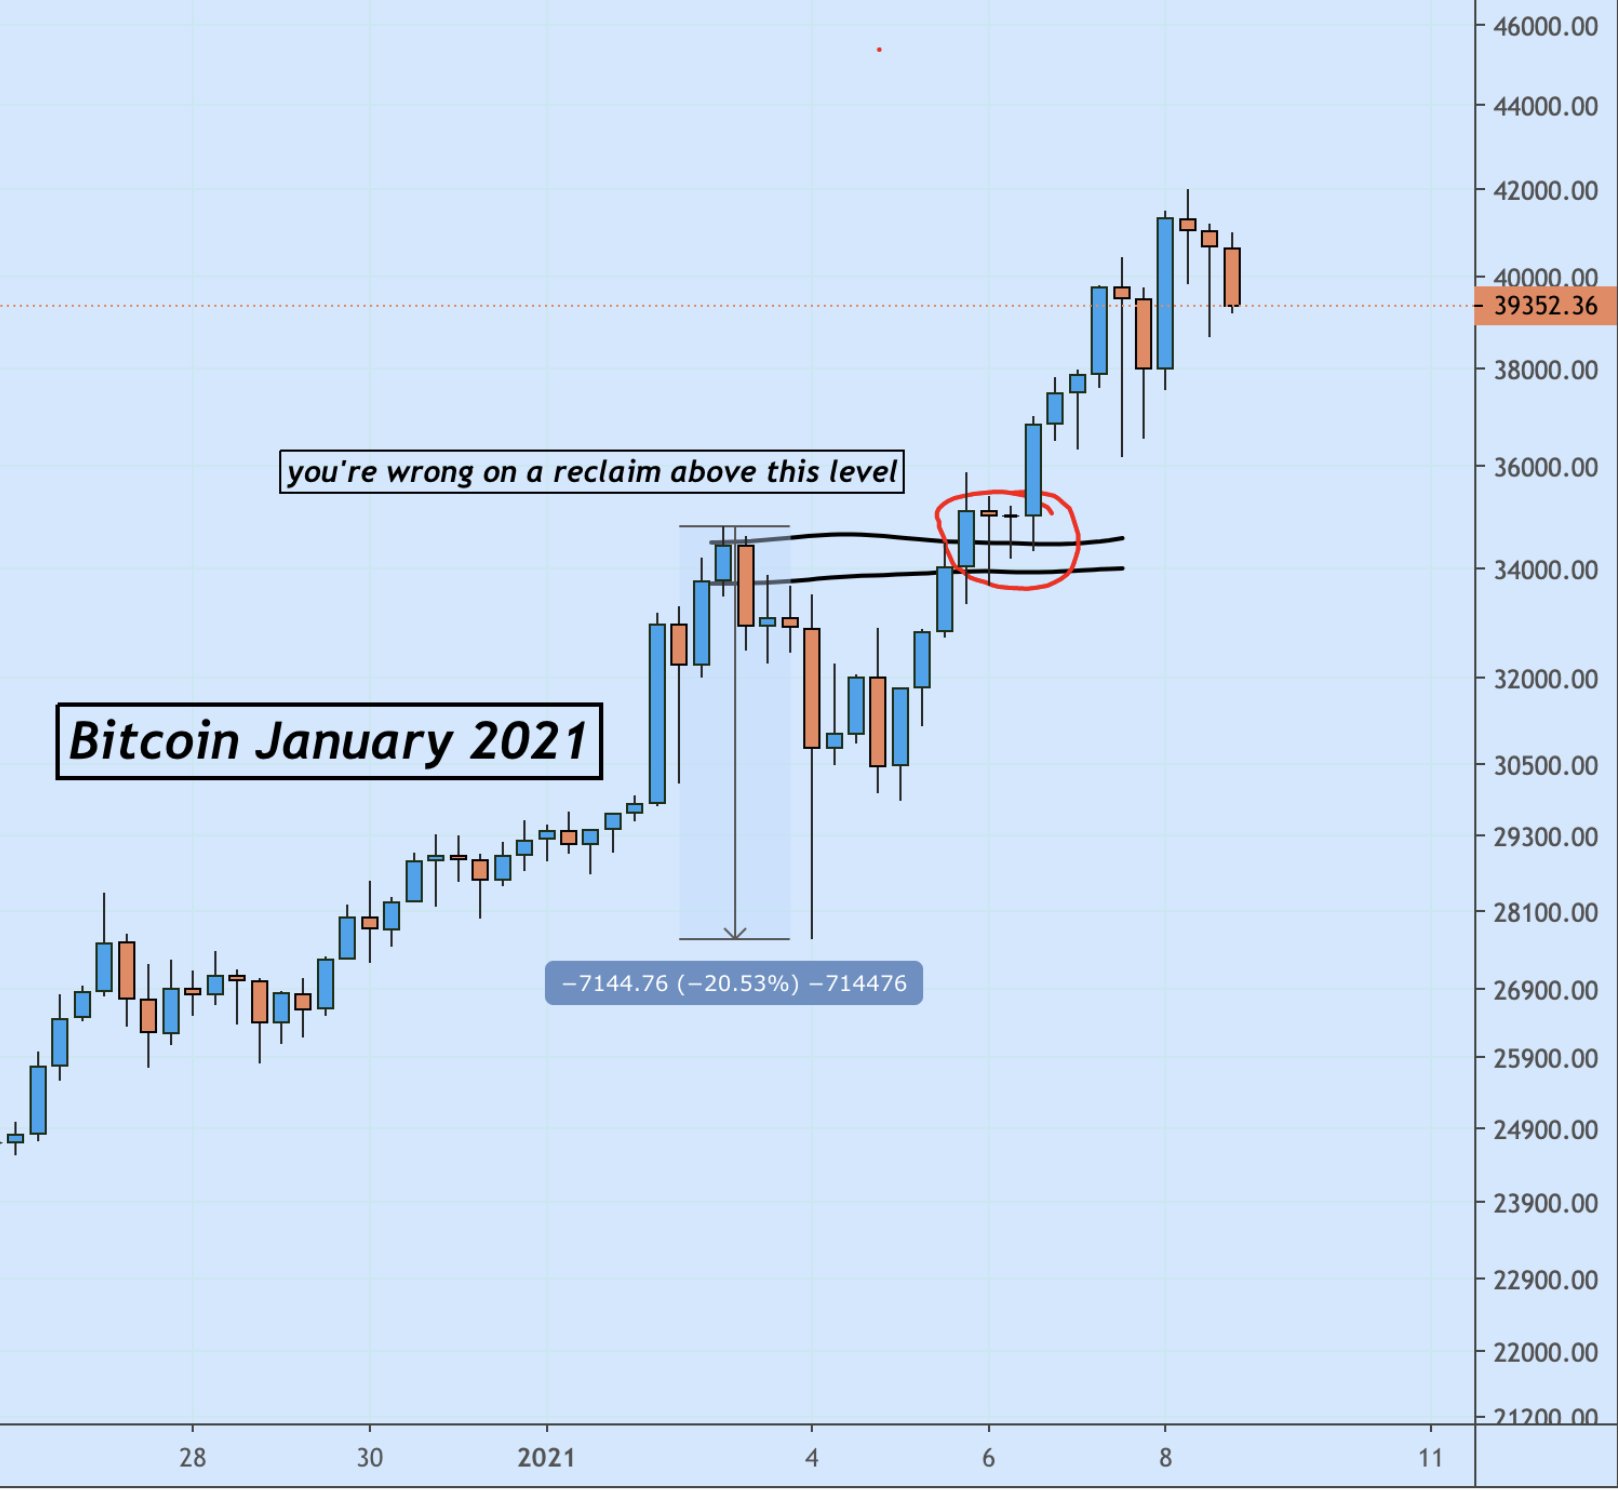
it’s nearly impossible to sell the top of these moves in real time, but you almost always get a throwback close to where the asset sold off from, which is your opportunity to de-risk and get out. nobody knows at the time whether that’ll be a local lower high or a macro top
Figure 3: Bitcoin, January 2021 — the “throwback to the sell-off zone” annotated on the chart. Red ellipse highlights the bounce into the supply region where the author would de-risk and exit.
Chain-relation note: fxtwitter currently returns replying_to / replying_to_status as null for this tweet, but both Thread Reader App and Rattibha independent archives include it in the same self-reply chain. This note treats it as Tweet 6.
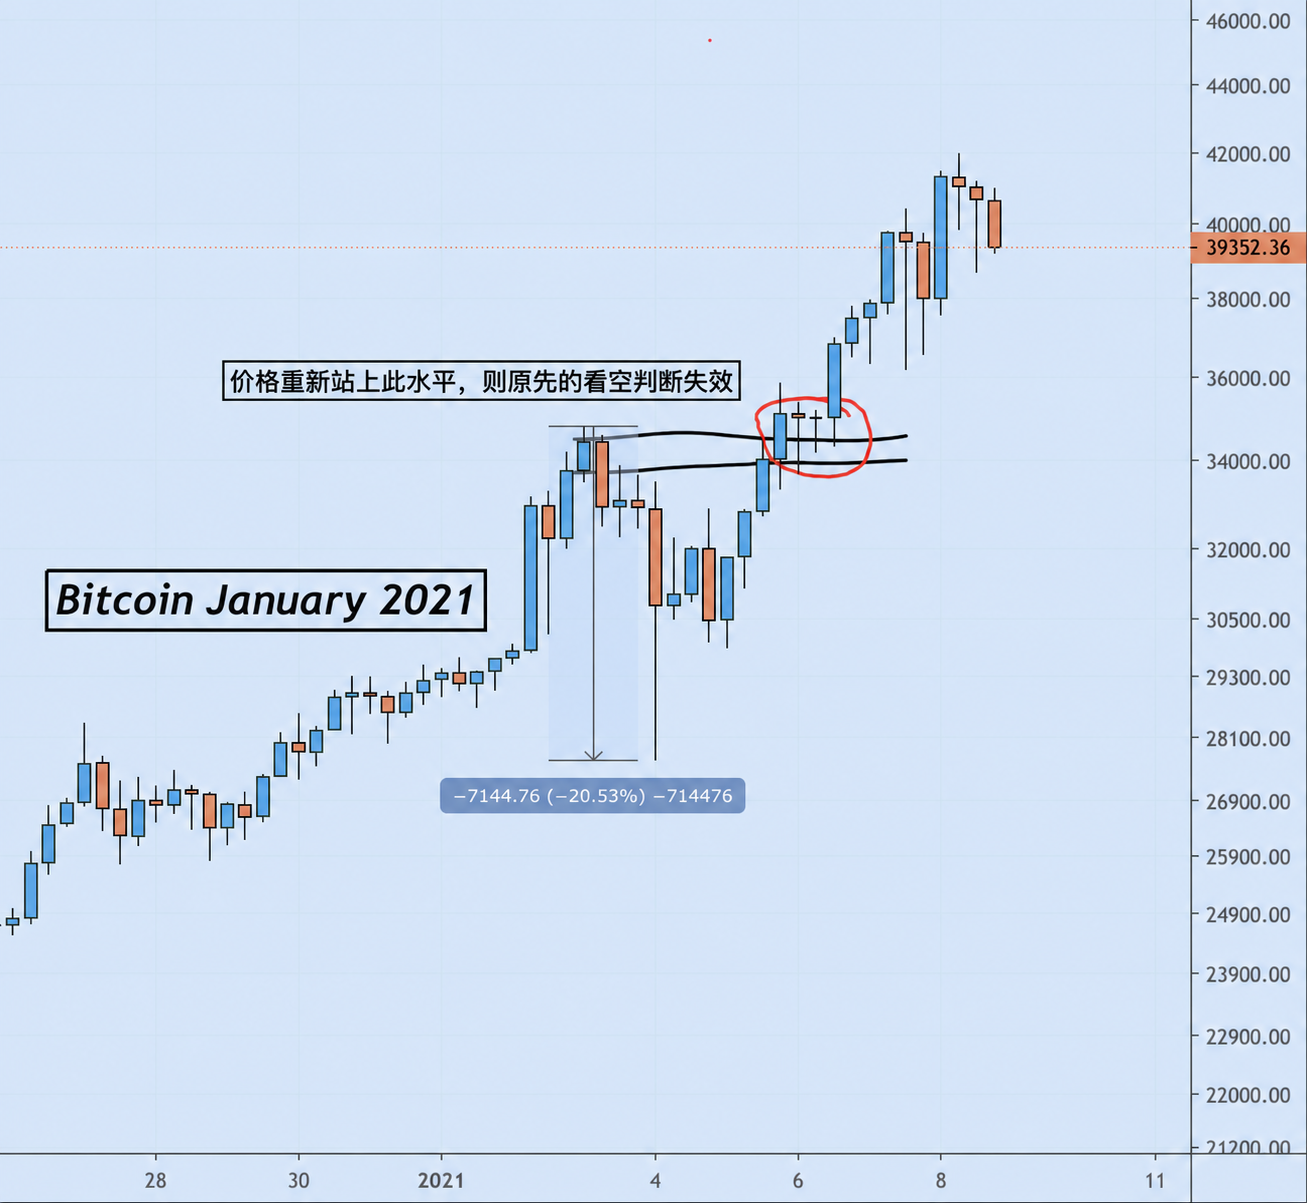
If you sell this bounce & you’re wrong, you know what your invalidation is to get back in and you don’t miss a large % of the move
Figure 4: Bitcoin, January 2021 — the post-throwback invalidation level. Bottom blue tag reads “−7144.76 (−20.53%)”, i.e. the depth of the throwback that defines the re-entry invalidation level.
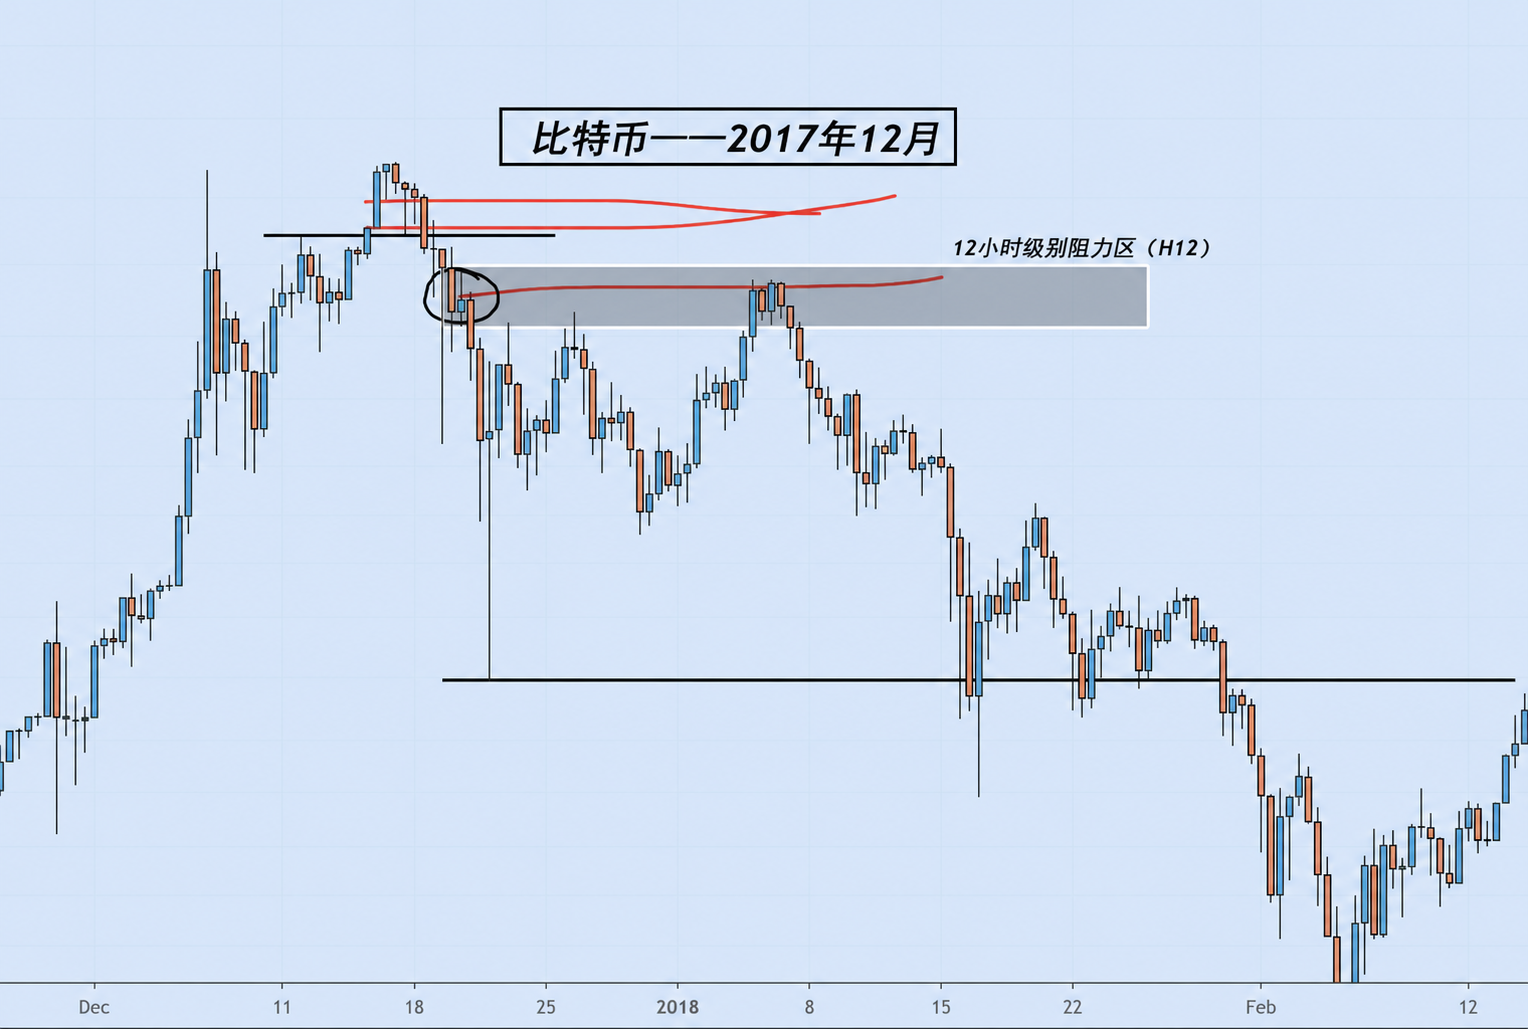
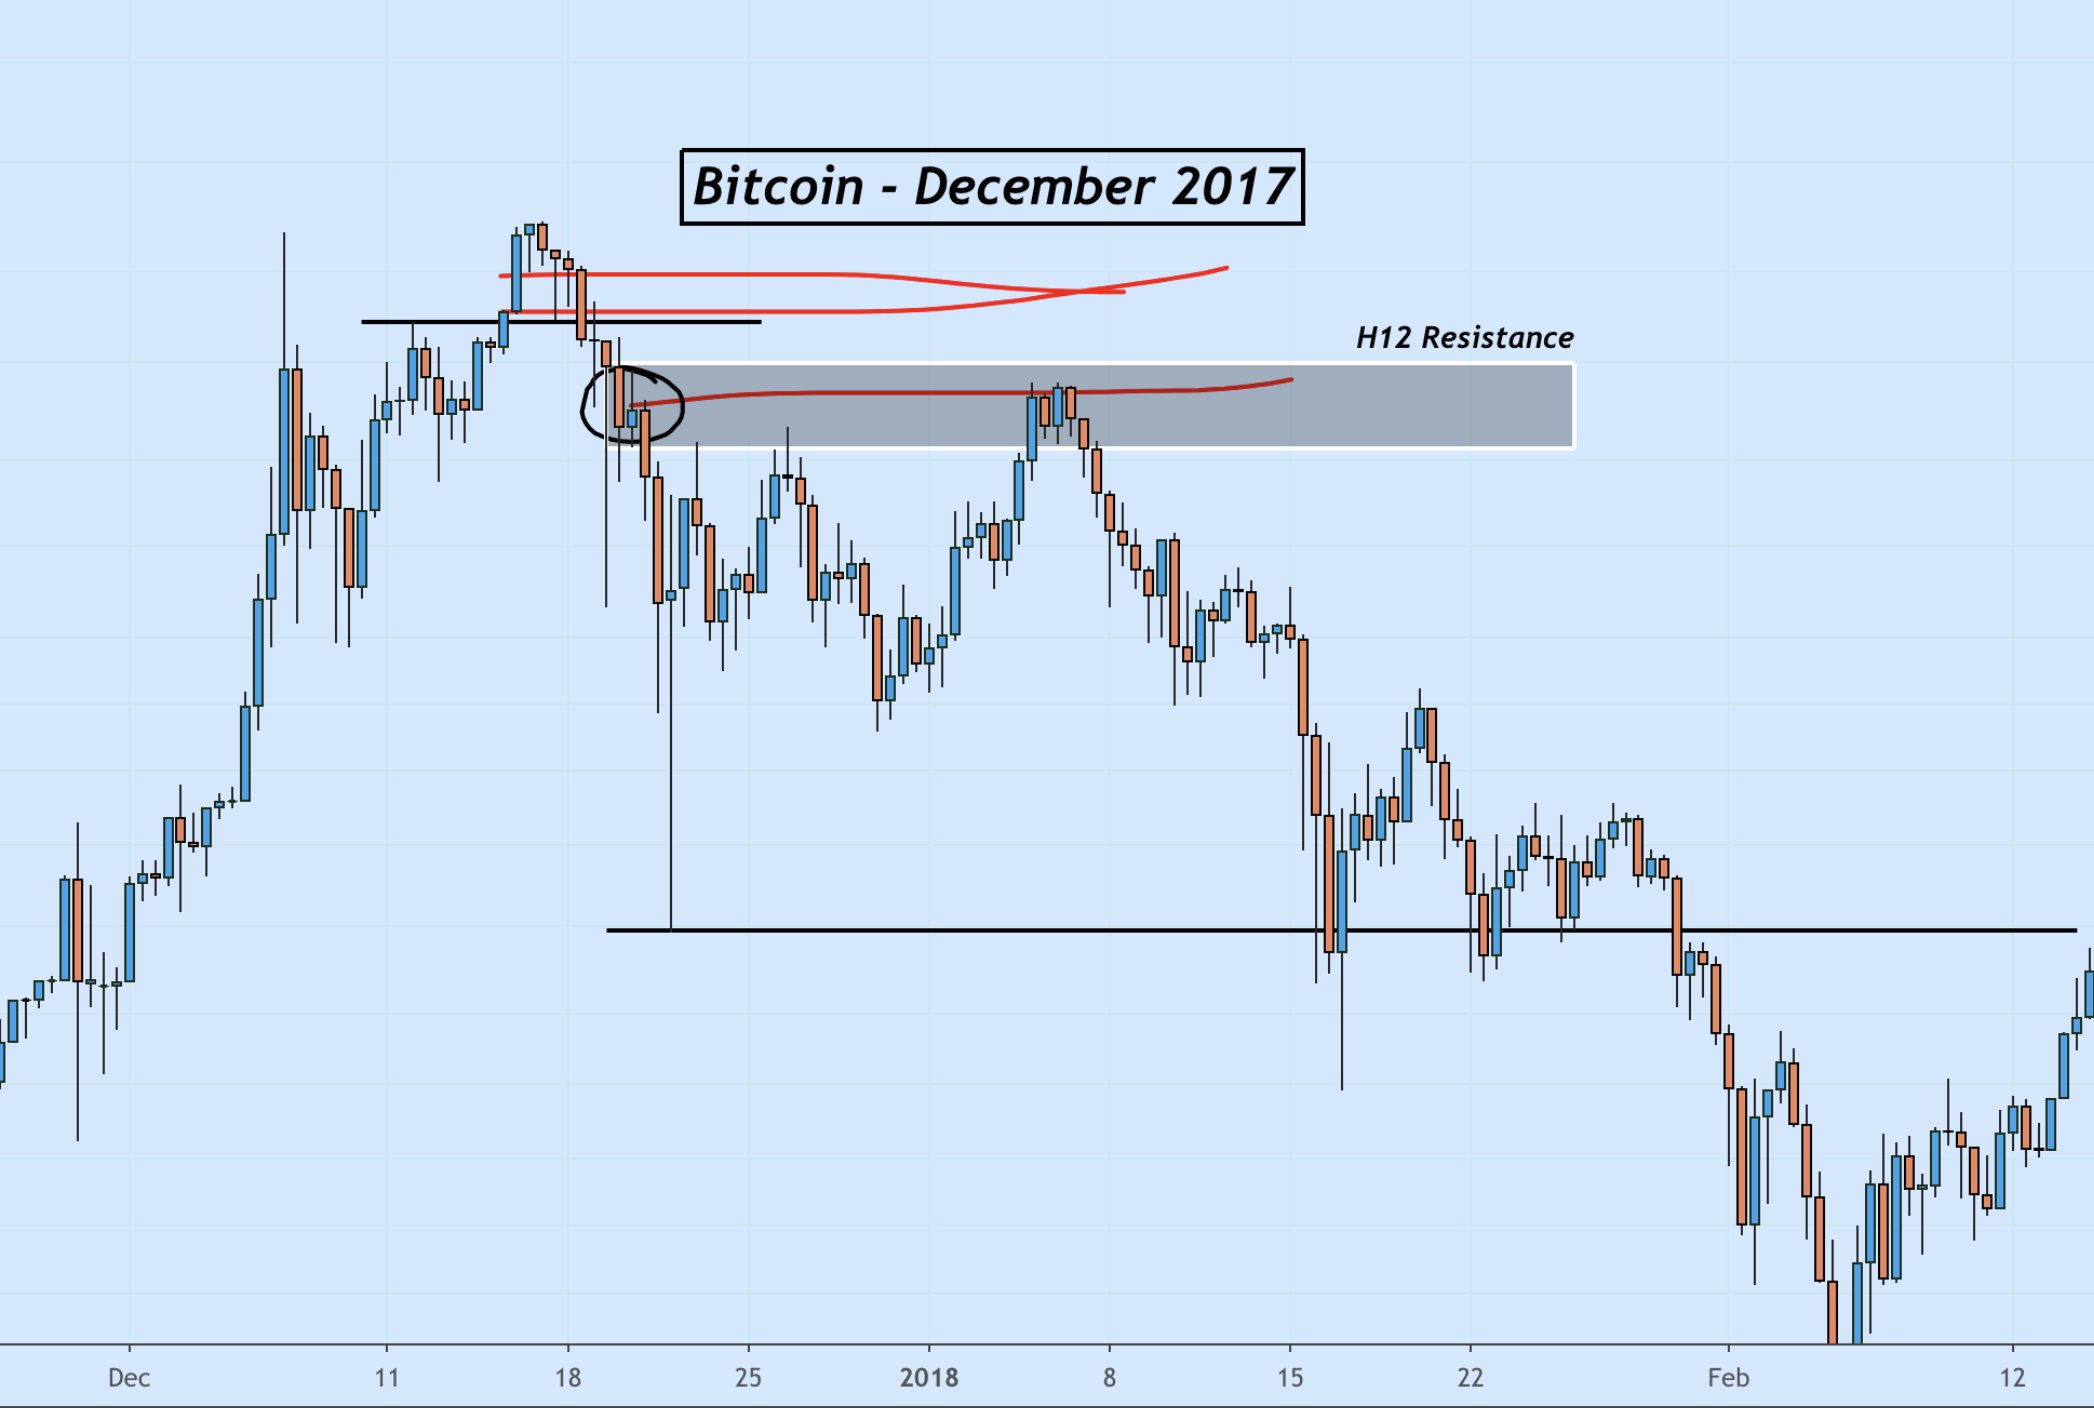
In December 2017, you didn’t necessarily get a throwback all the way to the origin of the selloff, but you did get a retrace back to the last H12 supply block. I’m usually looking at the H6+ candles to see where to get out
Figure 5: Bitcoin — December 2017. After the parabolic top, price did not retrace all the way back to the original sell-off origin; it retraced to “the last H12 supply block” (labelled on the right of the chart). Author says he personally anchors his exits to the H6+ candles.