简单说:我认为 AI 基础设施会是最值得买的(因为我们正在走最后一段主升);AI 受益方会随着 AI 帮它们做更多事而业绩更好;Crypto(虽然遭遇各种打击但仍未突破前高);Robotics(不是人形机器人本体,而是为人形机器人供货的供应链公司);Space 等 AI 和 Robotics 这波走完再上(因为它叠加了这两块的逻辑);以及 Health 相关标的,等 AI 真正整合进这些公司之后。
It will go over how I actively manage my money: both investing and trading, the strategy I use in both of these (when to buy and sell), and the relevant niches for this year.
Grab a drink, and a notebook. This will be a long, but good read…
This is how I am going to structure this article (if you want to skip around):
Part 1: My Portfolio Percentages and Diversification
Part 2: How I find what to buy when investing
Part 3: How I find what to trade
Part 4: How I buy bottoms
Part 5: How I sell tops
Part 6: Relevant niches for 2026
Part 7: What I’m buying now
I will both, teach you how to fish, and give you fish as well.
I hope you guys enjoy…
Part 1: My Portfolio Percentages and Diversification#
Ok, the first, most important thing you should do as an investor, is think about how risky you want to be.
For me, I want to be fairly risky.
So, I do a classic 25/75 percent split: 25% for trading (short term), 75% for investing (medium to long term). You can put less in the trading portfolio if you want to be less risky.
If my short term trading portfolio ever gets above 50% of my overall wealth (meaning: (short-term - long-term) >= 0.1%), then I rotate 50% of my trading portfolio over to my long-term investing portfolio.
Until, again, 25% of my overall portfolio is for my trading portfolio, and 75% of my overall portfolio is for long term investing again.
But, I never rotate any money from my long-term portfolio over to my short-term trading portfolio (no exceptions).
Even if my trading portfolio goes down in value.
I’ve revenge traded before.
It sucks.
How do I diversify in between trading and investing?
Well, for trading, I usually stick to what I think is the strongest narrative.
So only 1 niche there.
For investing, I usually do an even split between the fields I think will perform best (will go over this more later)…
For me, I do multiple different types of investing.
I like to use fundamental + technical analysis in every company I’m looking at.
But, the analysis will look different for each company (depending on what I’m buying them for).
There are a few types:
Turnaround plays
Fast-Growth plays
Fundamentally Undervalued
These are usually the 3 types of investment ideas I stick to.
The first 2 can be very, very profitable (think about buying $CVNA at 3 and riding it to 40+). Or buying $SIVE at $10 before it ran to $100.
The fundamentally undervalued companies might take a bit longer to go up, as it depends on when the overarching investors realize how undervalued the plays are.
But, for each of these areas, I use different criteria to judge what stocks to buy.
For turnaround plays, I look at a few things:
Is there a clear reason for why this company will turnaround. A clear, fundamental reason (AKA a thesis).
Is there some starting proof to show this reason will actually matter (ex: earnings).
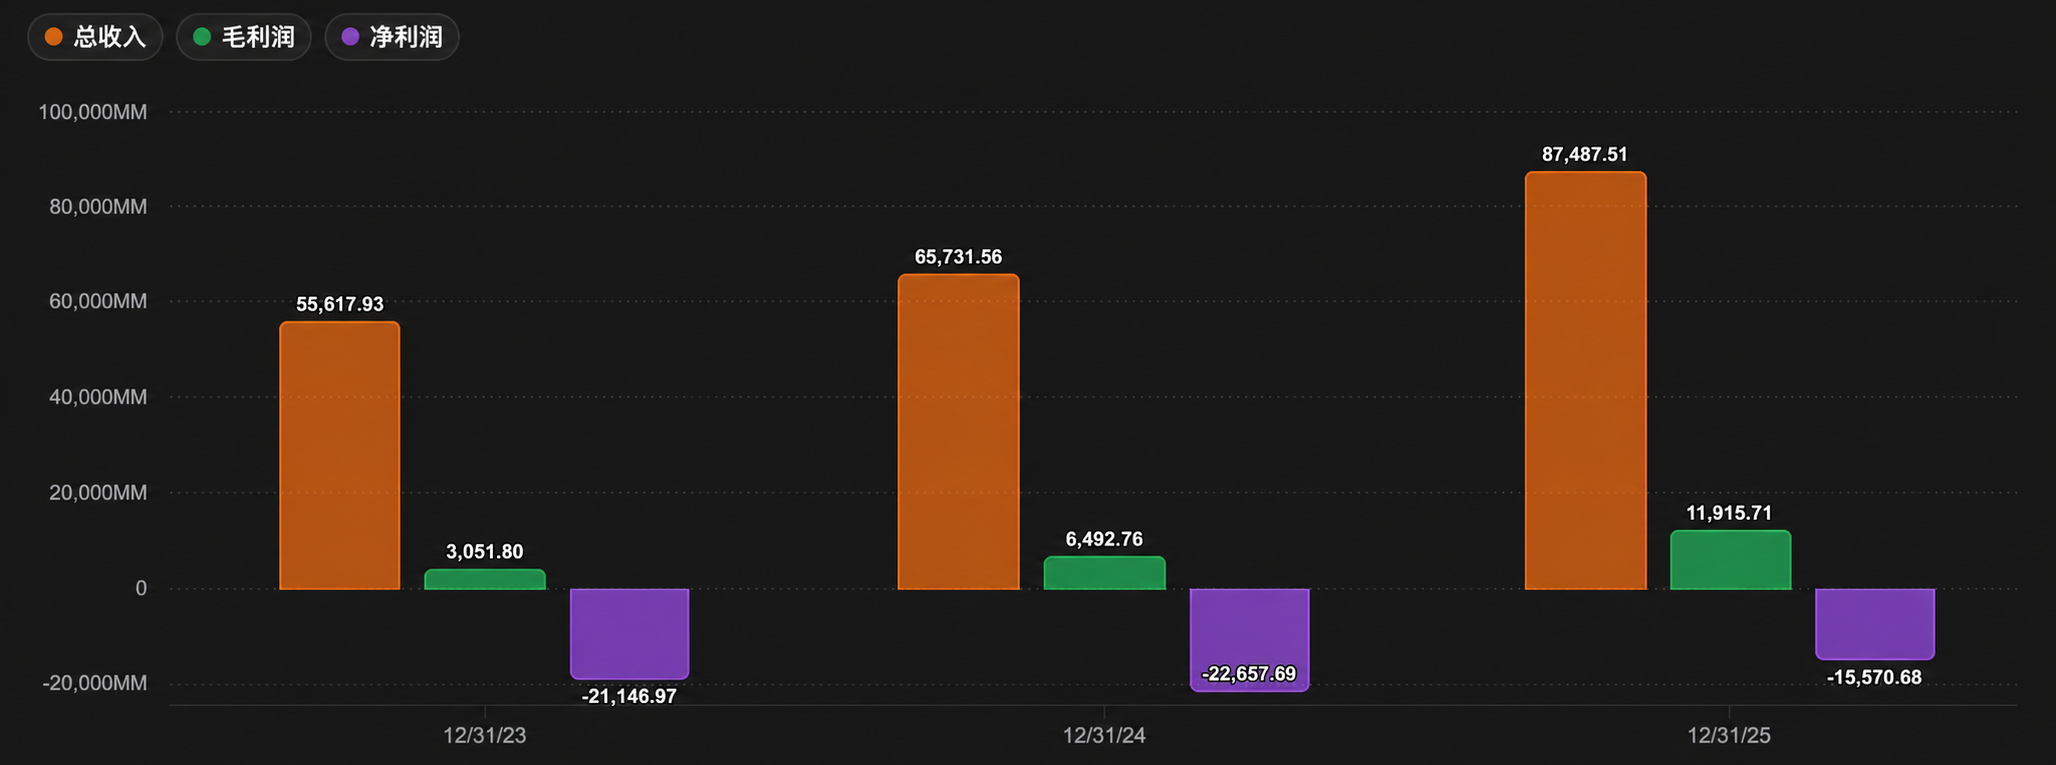
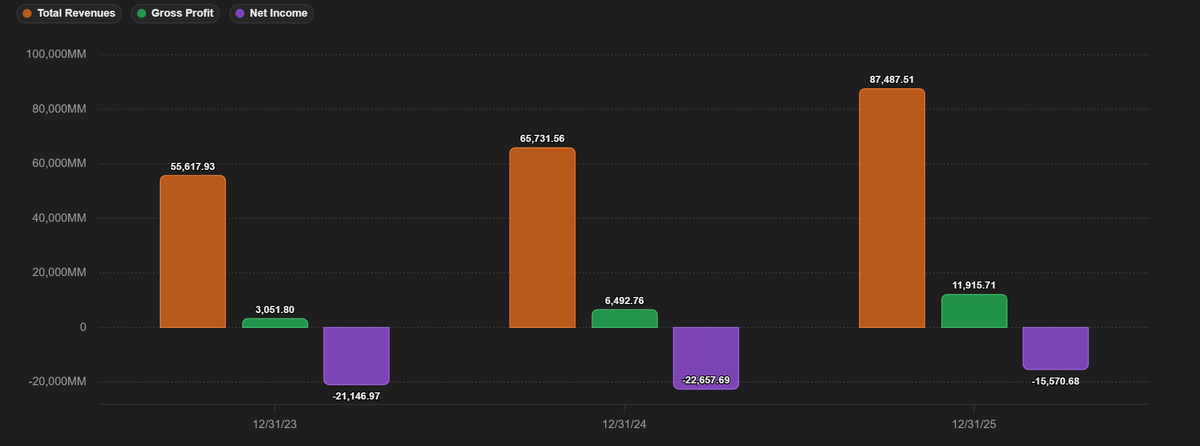
Are there earnings reports looking fantastic. What I mean by that is this:
Gross profit -> Increasing
Net income -> Increasing
Total Revenue -> Increasing
When a thesis is in place, the earnings showing (at the start) that this matters, is ideal to see.
Here’s a clear example of what we want to see.
Fig. 1: Earnings example the author wants to see (gross profit / net income / total revenue all rising)
Then we got fast growth plays.
These are riskier, but potentially more rewarding.
For these, the AI stocks have been the talk around town, and I use a method (adopted by @mkfilko), to find out what to invest in.
A 7 stage processes:
0) Enabler: Does this company build the foundation of the AI buildout?
1) Leadership: Is the founder experienced within this niche?
2) Revenue Quality: Is it recurring revenue, or a onetime sum.
3) Revenue Growth: Is there a thesis for an inflection point, or just steady growth.
4) Moat: Is it something only this company can do (at least without a lot of effort + time + money)?
5) Asymmetry: What’s the worst-case scenario vs the possible reward?
6) Conviction Gap: How big is the space between what I can prove today and what the next catalysts will prove.
7) TA: Are we in a bullish pattern formation, or a bearish one?
And lastly, the fundamentally undervalued companies are that, fundamentally undervalued.
This usually happens when they are worth less than the assets they hold (this actually happens).
This is rare. But when it comes up, it’s basically free money.
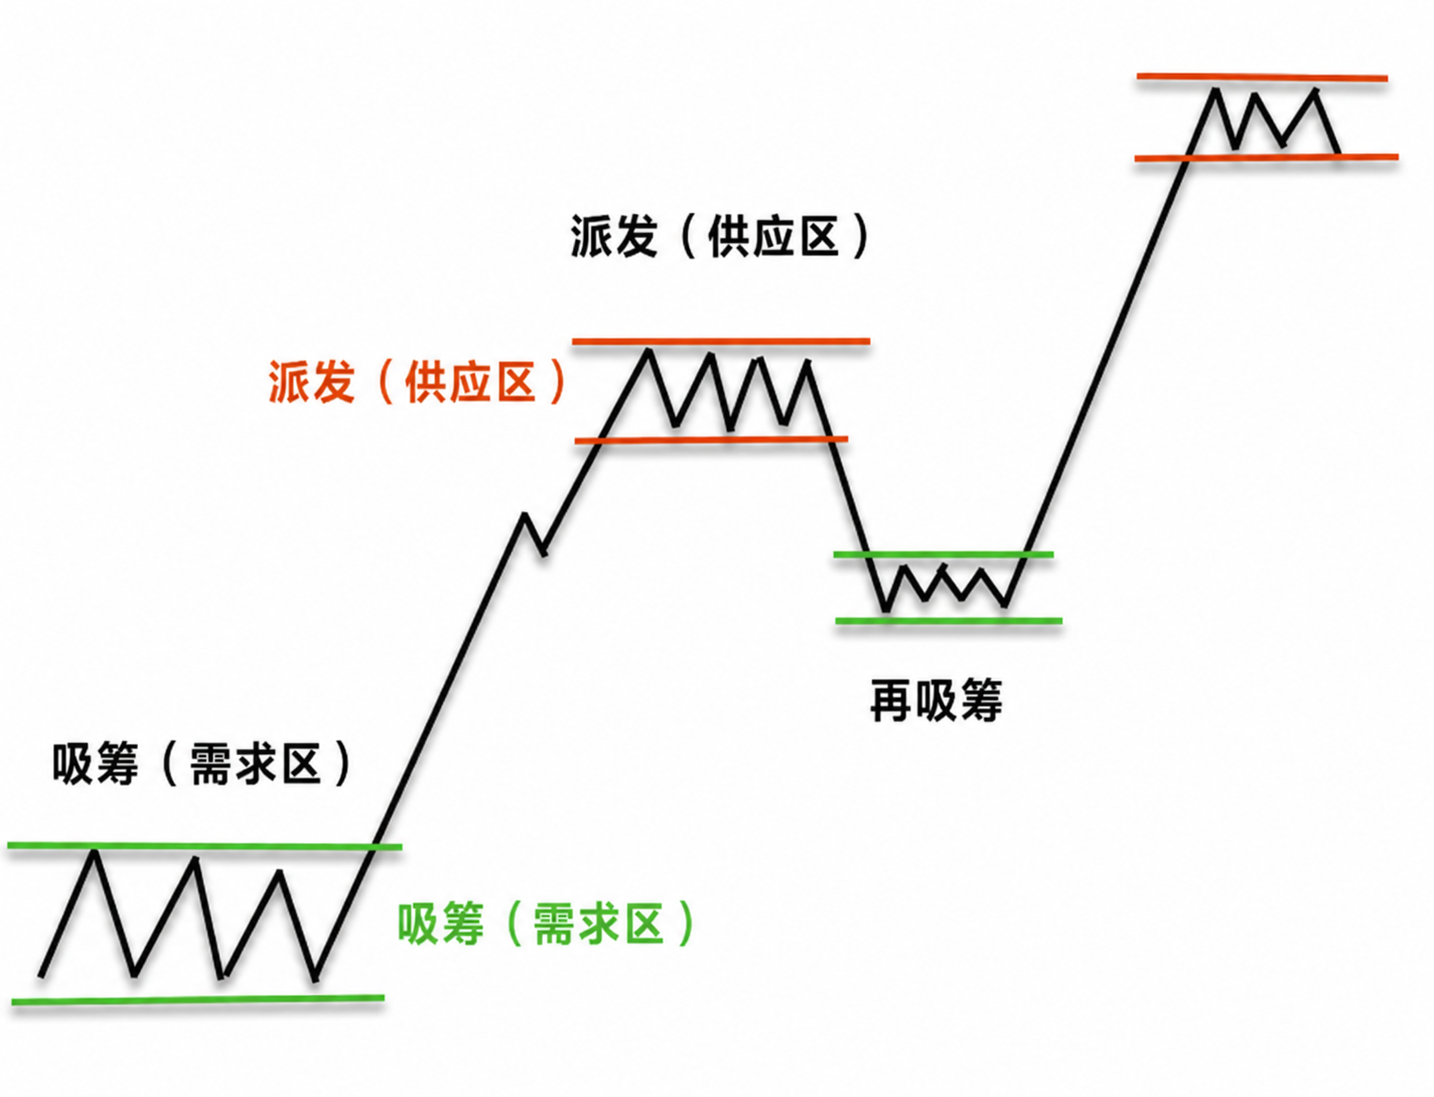
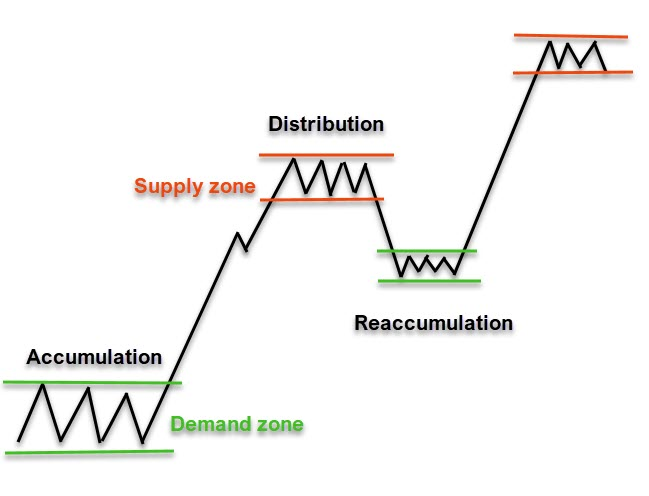
I’ll start this one off with explaining the difference between distribution/accumulation.
Accumulation is usually bullish: it starts once it hits support (usually a Fibonacci level). It then consolidates into another leg higher.
Distribution is exactly the opposite: it is bearish, and starts once it hits resistance (again usually a Fibonacci level), which then consolidates into a leg lower.
Fig. 2: Accumulation vs distribution example
There are a few different entries I like to take when investing.
I will go over them here.
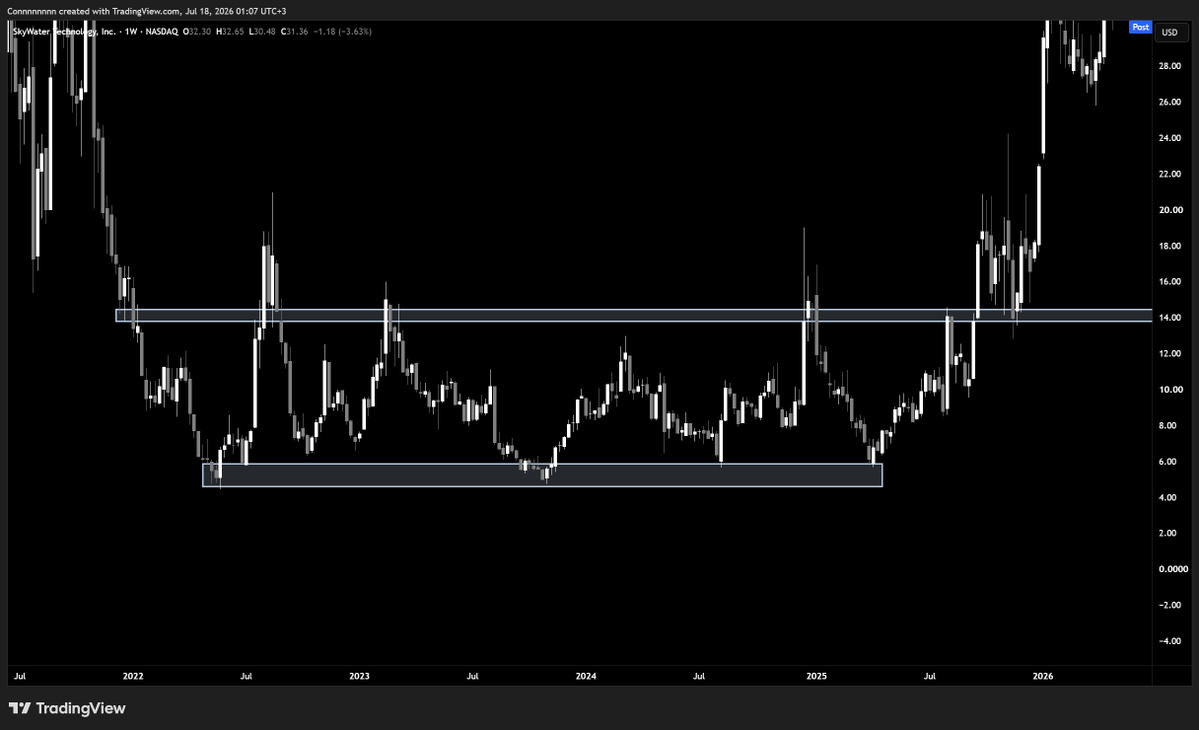
The first one is finding the narrative early, and buying when it’s accumulating.
Finding the narrative can be from anything: you’re looking around you on the street and see a lot of a certain company’s product. Then you research it and see how you think it will gain adoption even quicker.
Or perhaps you work in an industry and know a company is just up a coming. This is when you leverage your job.
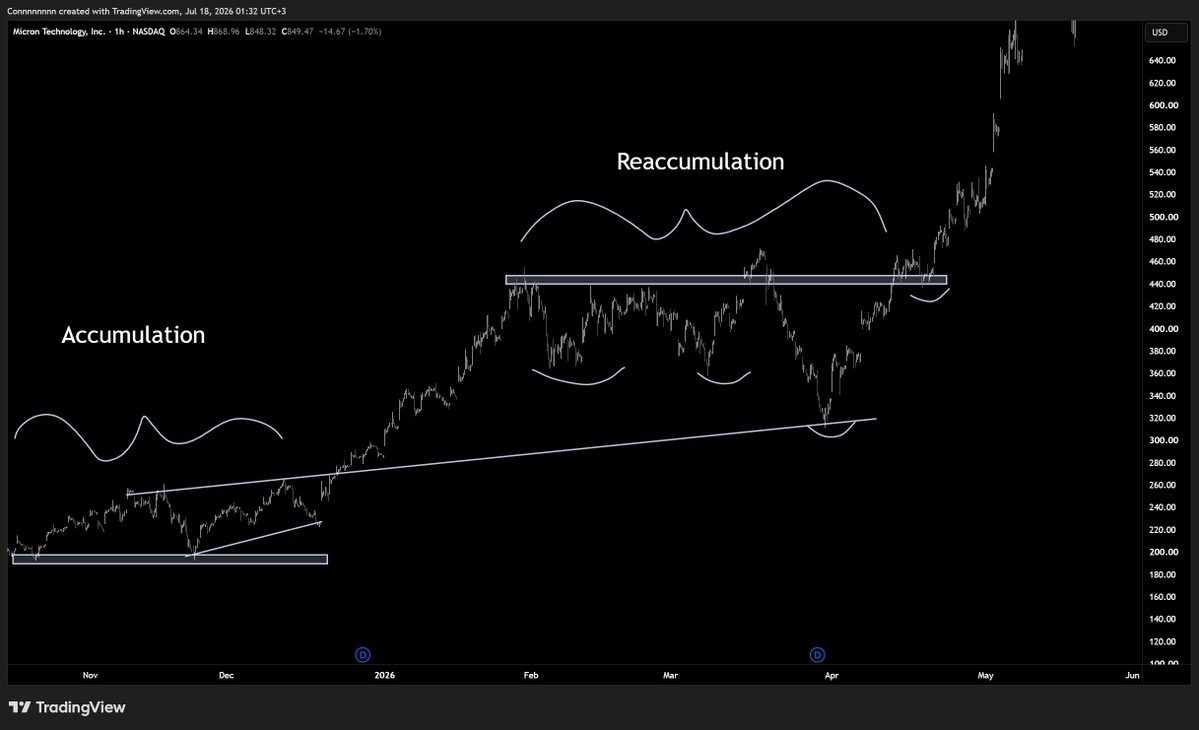
You buy when it’s accumulating, and before the main wave higher comes.
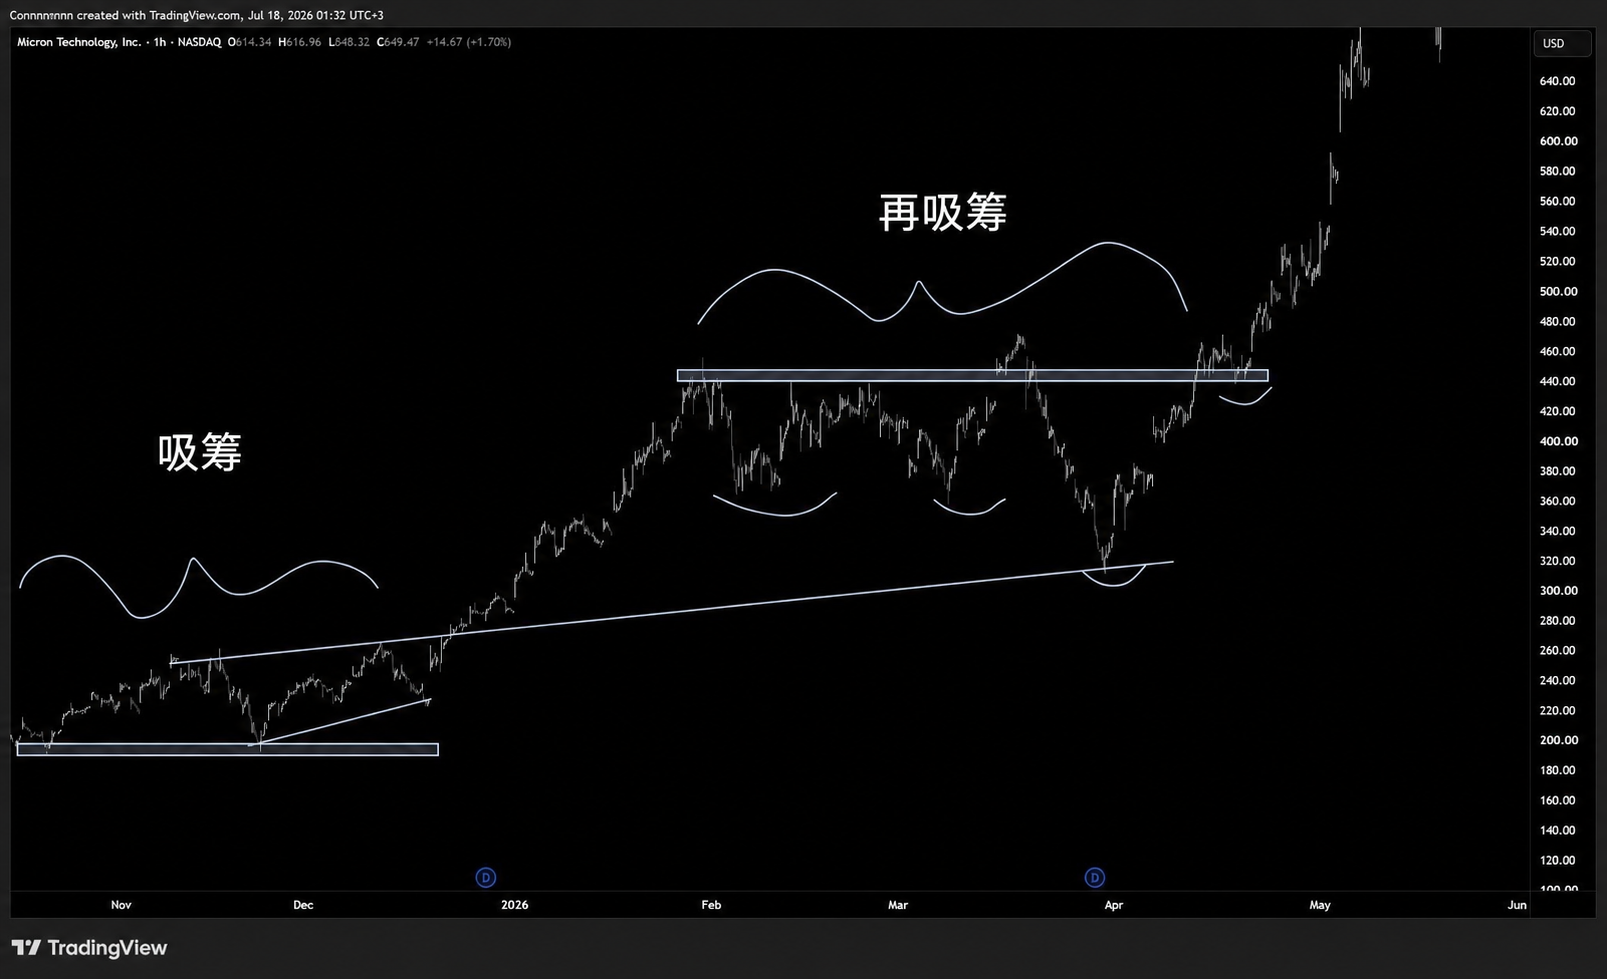
Fig. 3: Reaccumulation example
This second one is buying when the narrative has already been found.
But, buying in on a dip, the downturn within the macro wave up.
AKA: reaccumulation (as seen in the original chart above).
Now the reaccumulation doesn’t always have to be after a dip, but it usually is best to buy at the bottom of the reaccumulation (when it is hitting support), with a tight stop loss.
For this, you’re not necessarily early so to say, you’re just earlier than some, and you ride that wave up.
This ties in with the accumulation pattern as we talked about before.
Just, now, we’re going to use X (or another form of social proof, such as Reddit, YouTube, etc.) to see what people think of the overall stock.
If people are screaming for it to go lower, talking just FUD, yet the company is only getting better, then this might be a bottom.
So I like to see some accumulation before buying in.
These are usually around Fibonacci levels. If it’s just a dip, it’s probably a Fibonacci retracement, but if it’s making a new low, then use Fibonacci extension.
What you’ll eventually see is that Fibonacci levels usually correspond with either all time high levels, or just “attractive levels” to be getting in at.
At the end of the day, that’s how they work.
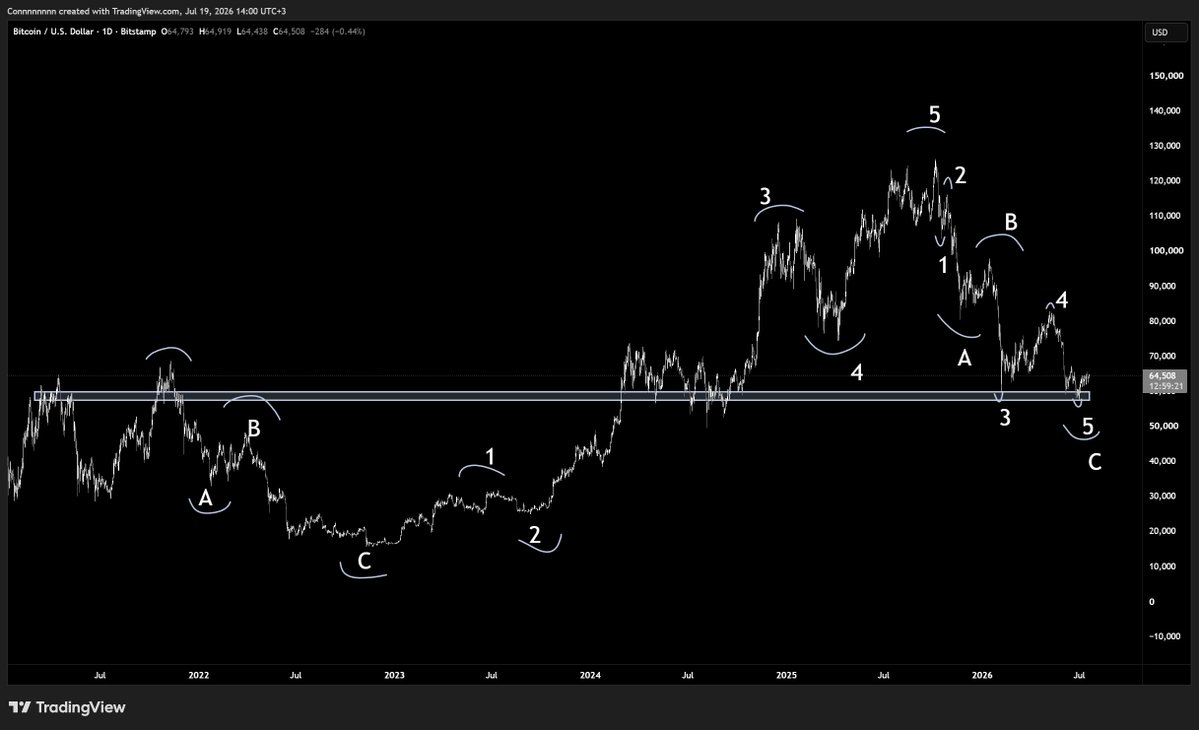
In confluence with this, I like using elliot wave theory.
This theory is simple:
That markets work in “waves.”
Each wave goes a different % increase, and usually is because a different group of individuals buy.
This is how it works:
Impulse Wave (1-2-3-4-5):
Wave 1: The initial move in the trend direction (smart money buys early).
Wave 2: Pullback (prices retrace, but don’t go below the start of Wave 1).
Wave 3: The strongest and longest move (mass adoption of the trend).
Wave 4: Another correction, often weaker than Wave 2.
Wave 5: Final push in the trend direction (fueled by FOMO).
Corrective Wave (A-B-C):
Wave A: Price goes against the trend.
Wave B: Partial retracement (people think trend will continue).
Wave C: Final move down, completing the correction.
With this, every A-B-C is within a 1-2-3-4-5, and every 1-2-3-4-5 is within a A-B-C.
And from Elliot wave theory, we then make cup and handle formations, and inverse head and shoulders (the end of the C wave).
I like to use these in confluence: both fibonacci and elliot wave theory to then know that the bottom is in (like the picture below).
Fig. 5: Bottom-identification chart with elliot waves / cup & handle / inverse H&S
Instead of buying during accumulation, now we’re selling during distribution.
A way I like to think of accumulation vs distribution is that accumulation cups upward while distribution cups downward (or like an upside down cup).
Usually, while it is distrubiting, it is in a tight bearish channel formation.
And either the narrative slows down, or a drastic fundamental change happens soon later (to push price down). Classic, human psychology.
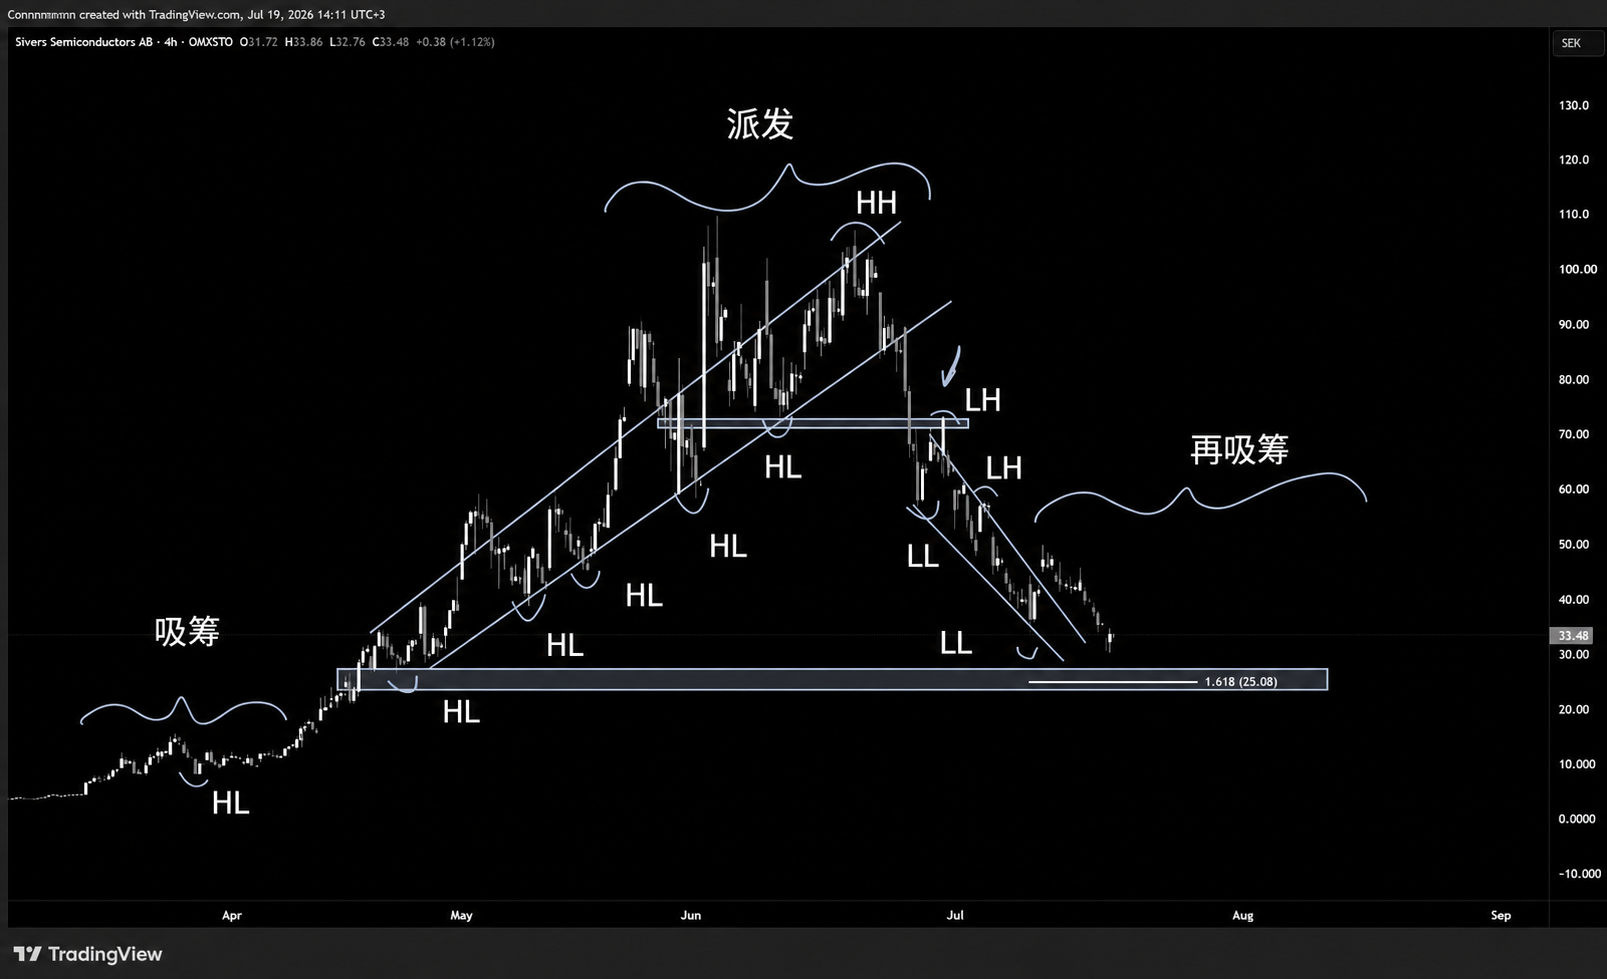
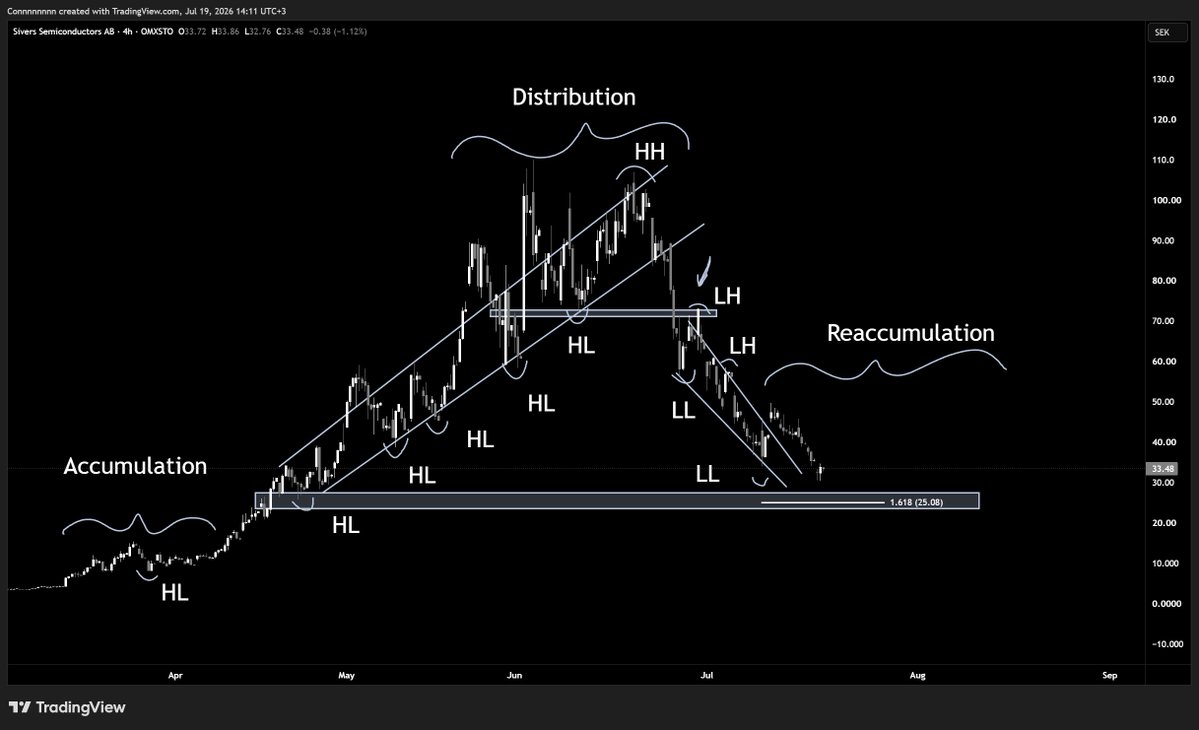
$SIVE is the best example of this:
Fig. 6: $SIVE distribution example
We were making continual higher highs (HH), and continual higher lows (HL), but then the structure breaks and we send lower.
Continuing the cycle over again, this time with lower lows (LL) and lower highs (LH), which we go into another accumulation.
It is always hard to time the exact top on these.
Like very hard.
I’ll go over how I did it for $NBIS in a bit, but for now, I’ll give you the safer approach.
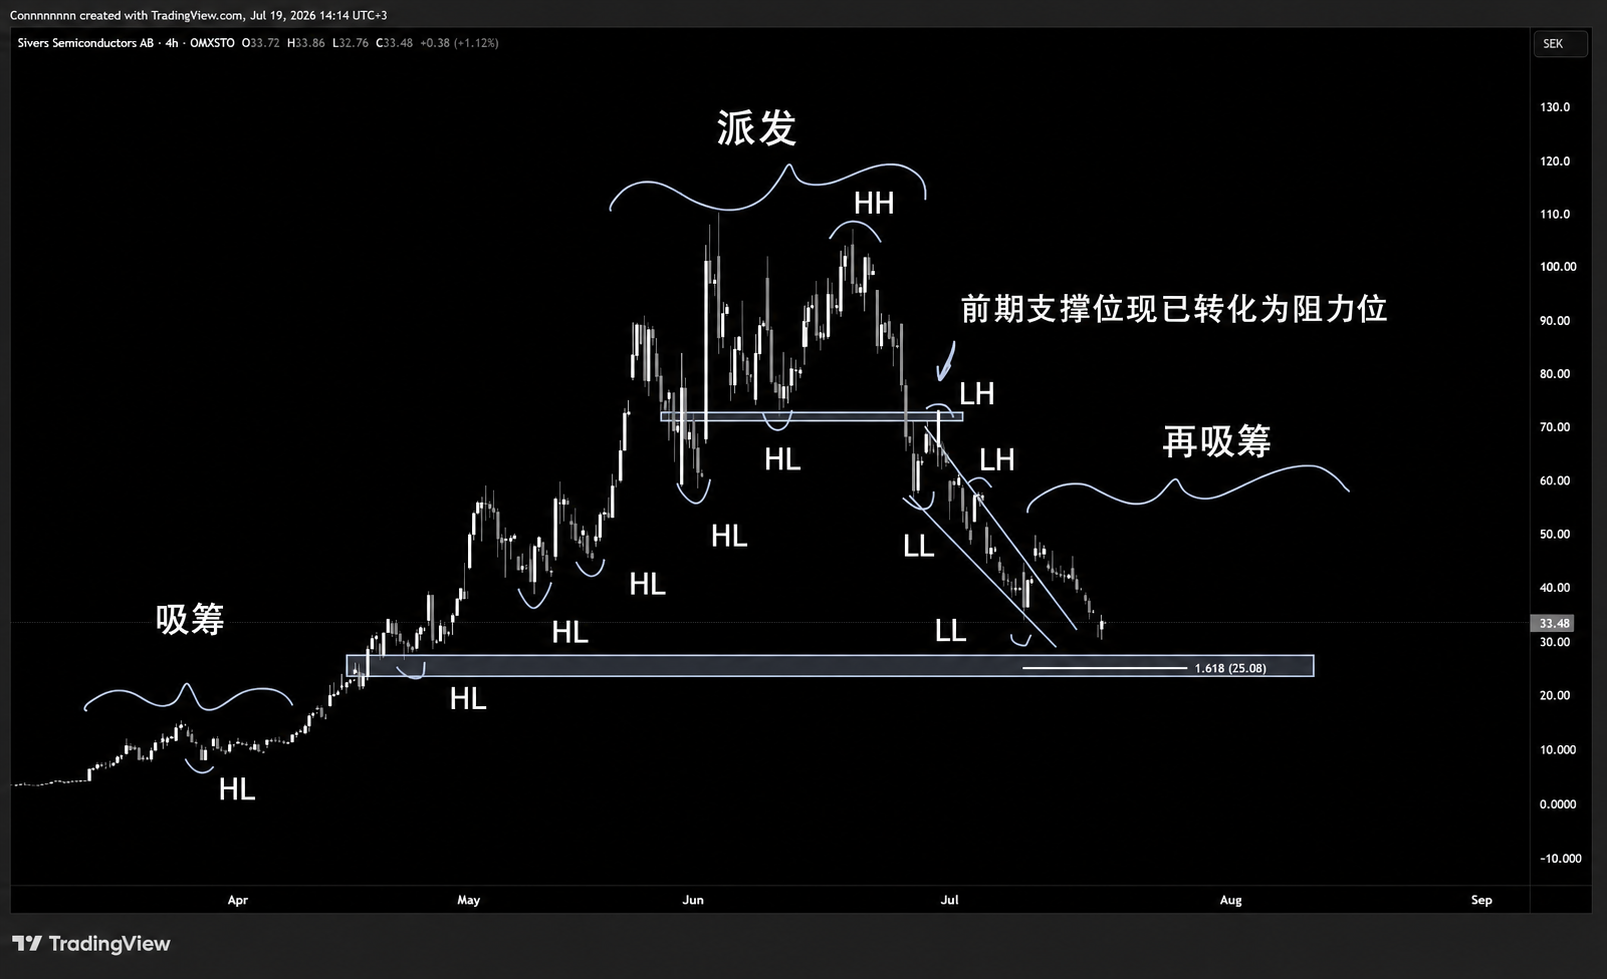
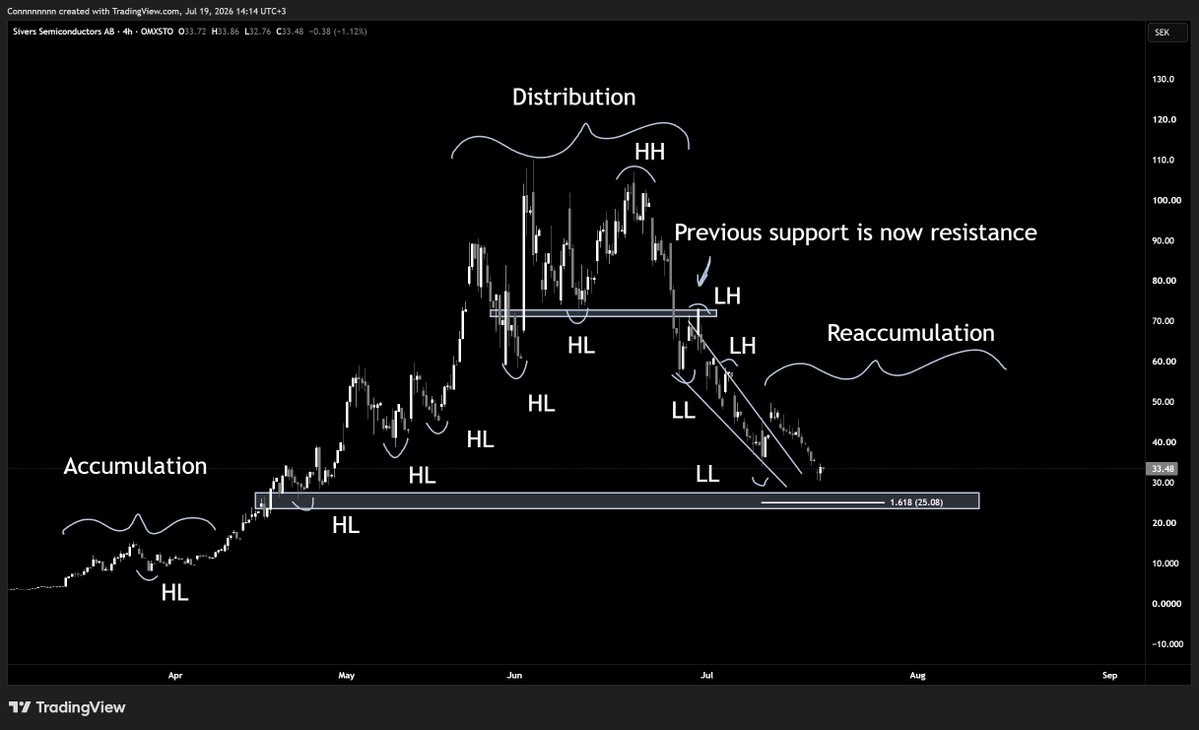
The easier approach is to sell when the trend has cofirmed it’s now making lower lows, and then wait for a retest of the previous support, now as resistance.
This is how I played the $SIVE chart.
It wasn’t the exact top exit, but it was a great exit in the profits, with a clear invalidation if $SIVE broke above this line and held it as support (see chart below).
Fig. 7: $SIVE retest of former support as resistance — sell trigger
Now, how did I time the $NBIS top exactly? And how can you do the same?
This is a bit different.
And a bit more difficult.
OK, now we’re going to use multiple things we’ve just learned, to now try and time the exact top.
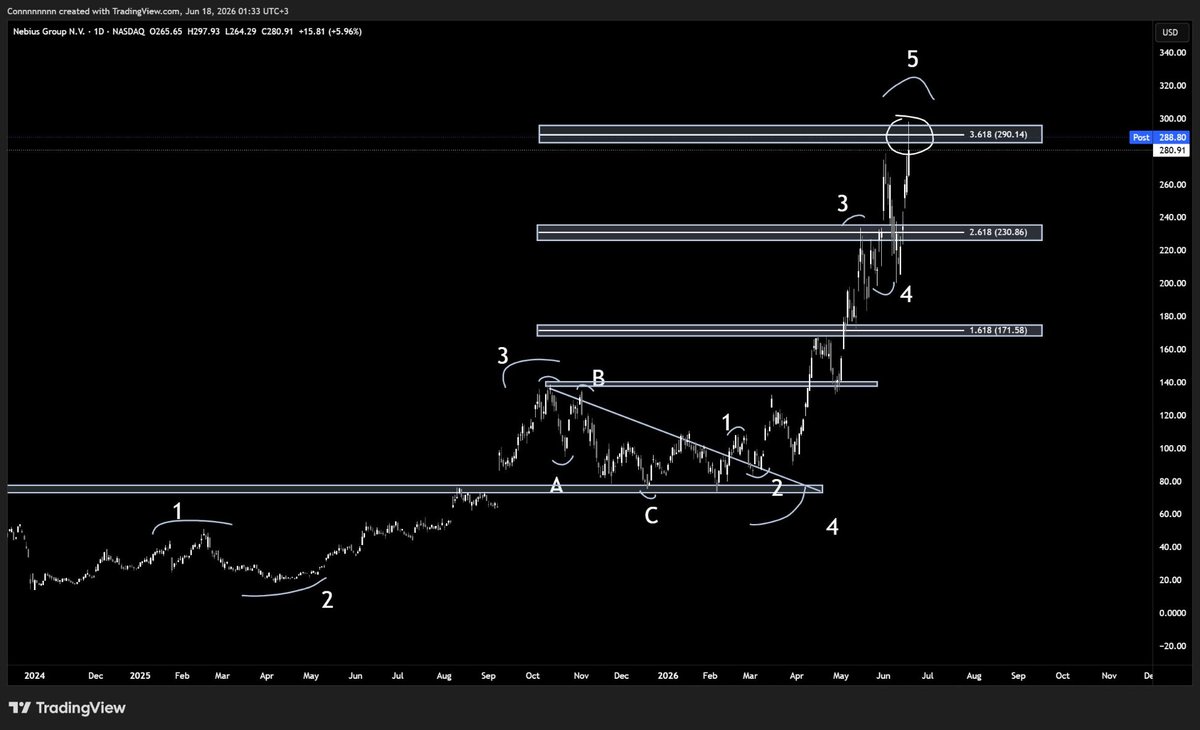
Here, we use elliot wave theory (both on the higher time frame, and the lower time frame), with fibonacci levels, wedges/channels, and the classic distrubtion formation.
But, we add something else in there.
This time, we add in a special method to selling tops. One, that not many people use.
The method we’re about to use is for fast growing stocks only.
Fast growing. Like the AI stocks we just saw run type of fast growing.
If the asset is parabolic (use trendlines for this), then that means this won’t work.
I mean fully parabolic.
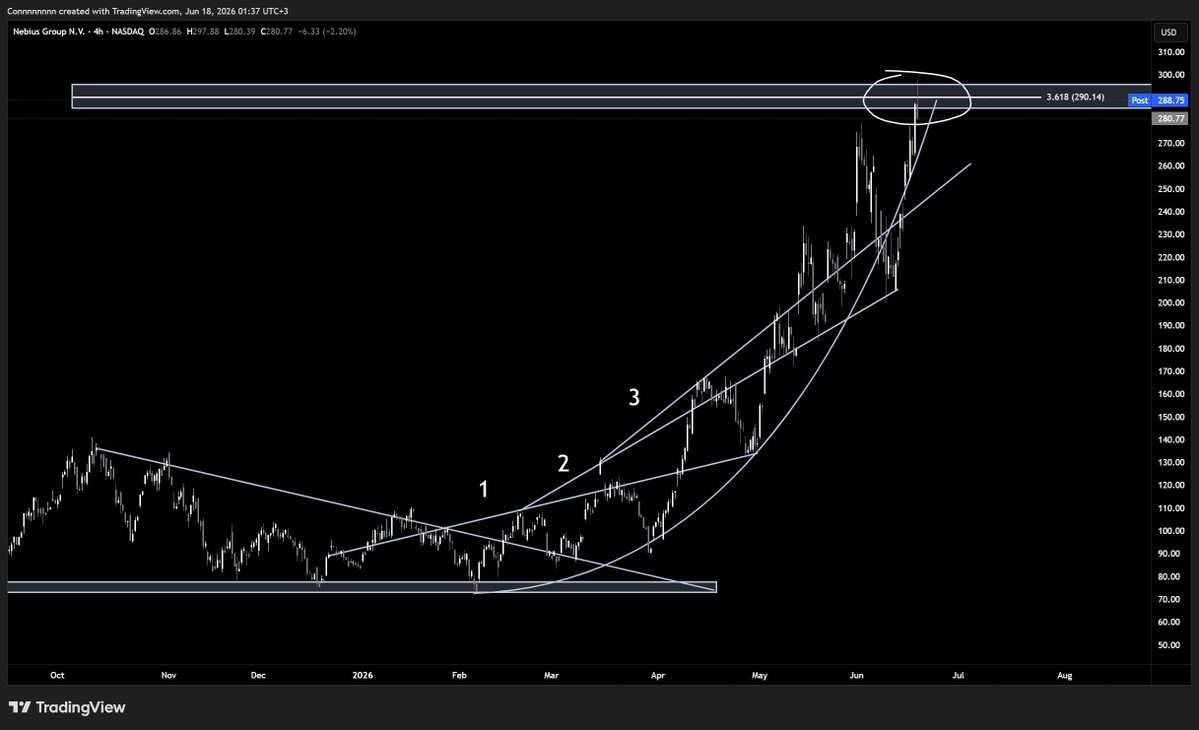
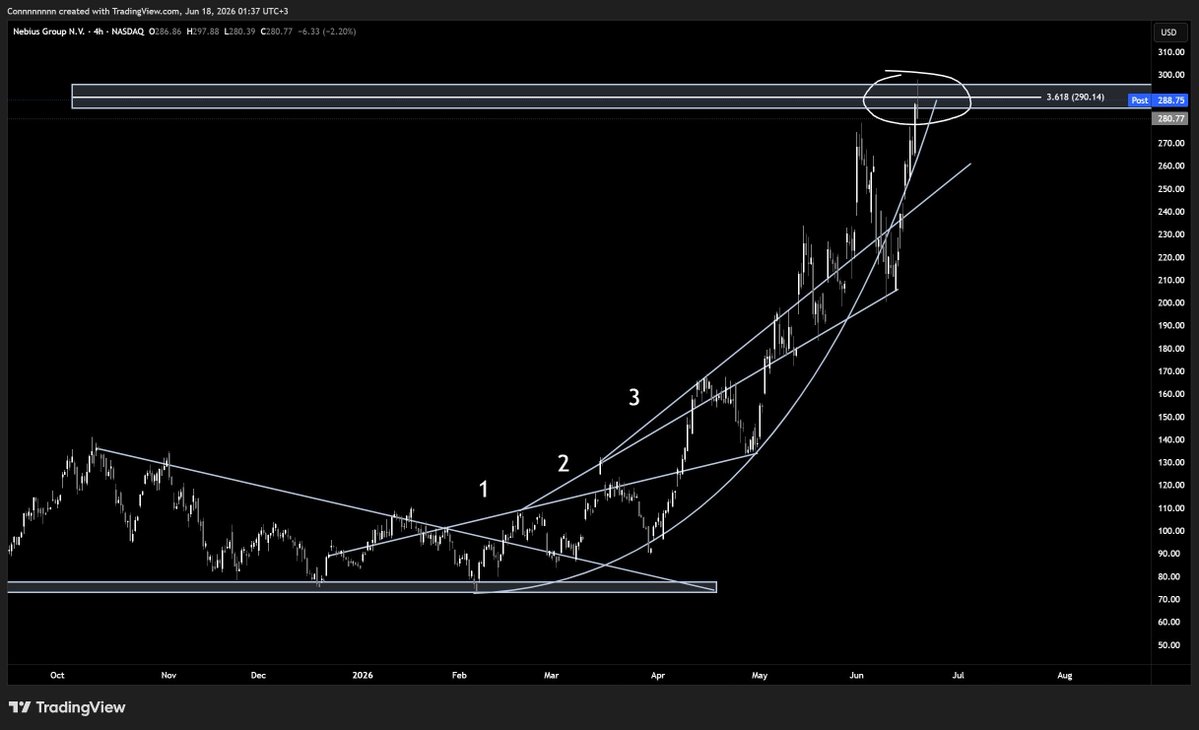
Fig. 8: $NBIS parabolic final leg
An example would be if $NBIS broke above this resistance line here (the 3.618 level).
This is already one of the most overbought fib levels (1.618 if fair, 2.618 is overbought, the 3.618 is crazy), but, if it broke above this level and used it as support, after already being in this parabola upwards, then that means this theory doesn’t work.
So we re-enter if it breaks above and use it as support (miss out on a 5% move, not a big deal).
But, the downside could be catastrophic.
Fig. 9: $NBIS stalling out with 3 trendlines of support/resistance
The chart above is when I called the top.
Now let’s go into if it’s not fully parabolic.
If it’s not, it usually starts stalling out like the chart above ($NBIS did).
And we usually see volatility increase and some whipsaw like moves before this overall top (like we did with NBIS).
With this, we usually have 3 trend lines of support/resistance (in a x/y chart type of drawing, meaning diagnal).
If we see a break above this, and confluence of an overarching higher time frame and lower time frame resistance area (from fibonacci levels and elliot wave theory).
It makes sense to sell. At least for the short term.
So we have the confluence of both of these charts (as seen below):
Fig. 10: Higher / lower time frame resistance confluence
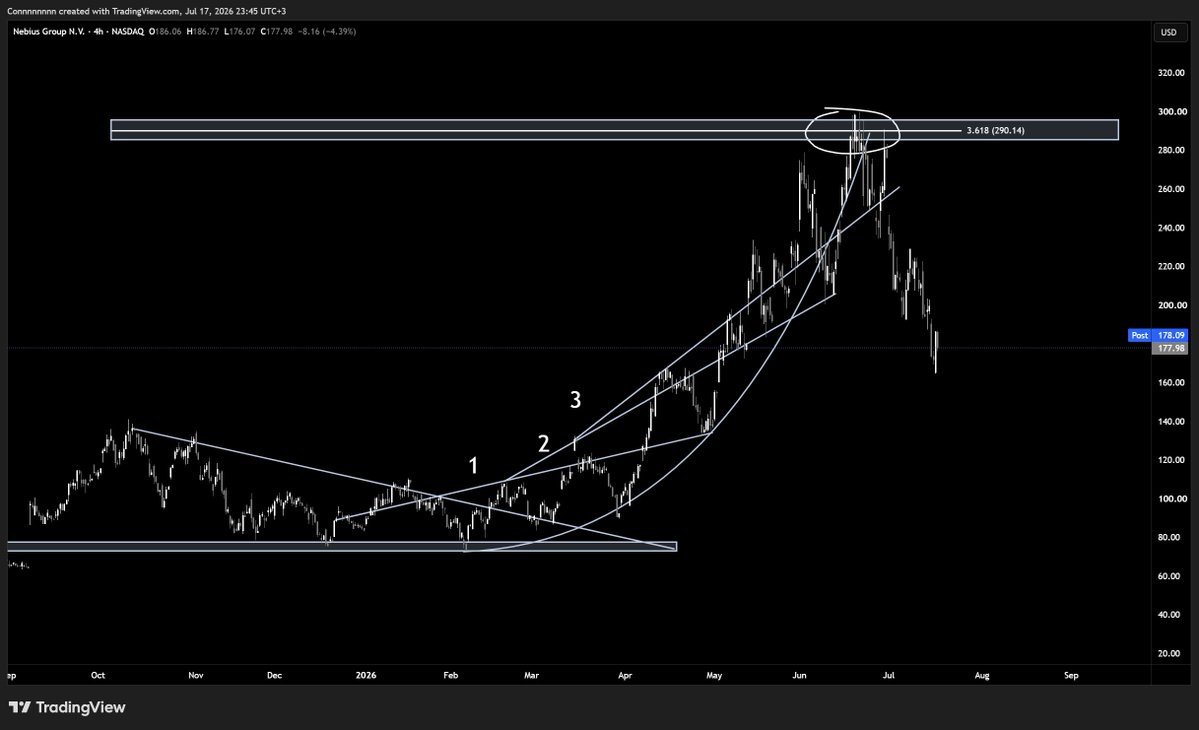
And if we end up playing this right, the chart should end up sending lower.
Into, of course, another reaccumulation phase (which is why I’m buying $NBIS now, here after a 40%+ drawdown).
But in a TLDR manner, I think AI enablers will be the stocks worth buying here (as we’re going into our last leg up), AI beneficiaries as AI increases how well these companies do, crypto (as we’ve been hit with everything but haven’t broken past previous ath levels), Robotics (not humanoids, but the companies supplying to the humaoids), Space stocks after the robotics and AI wave goes by (as it couples both of this), and health related stocks once it integrates AI into their companies.